


In the landscape of business operations, specialized calculators can be indispensable tools, enabling professionals to streamline complex arithmetic with precision and efficiency. For some industries, these calculators can even be the bedrock of decision-making: think intricate health insurance quotes or the financial labyrinth of mortgage calculations, all based on multiple, often complex factors.
They not only allow for rapid computations but also offer insights crucial for strategic planning and financial management. As businesses aim for greater agility, more developers are looking to build customizable solutions that cater to specific requirements.
In this article, we will show you how you can use a business software development platform like Retool to build your business calculator.
Here’s how it looks:
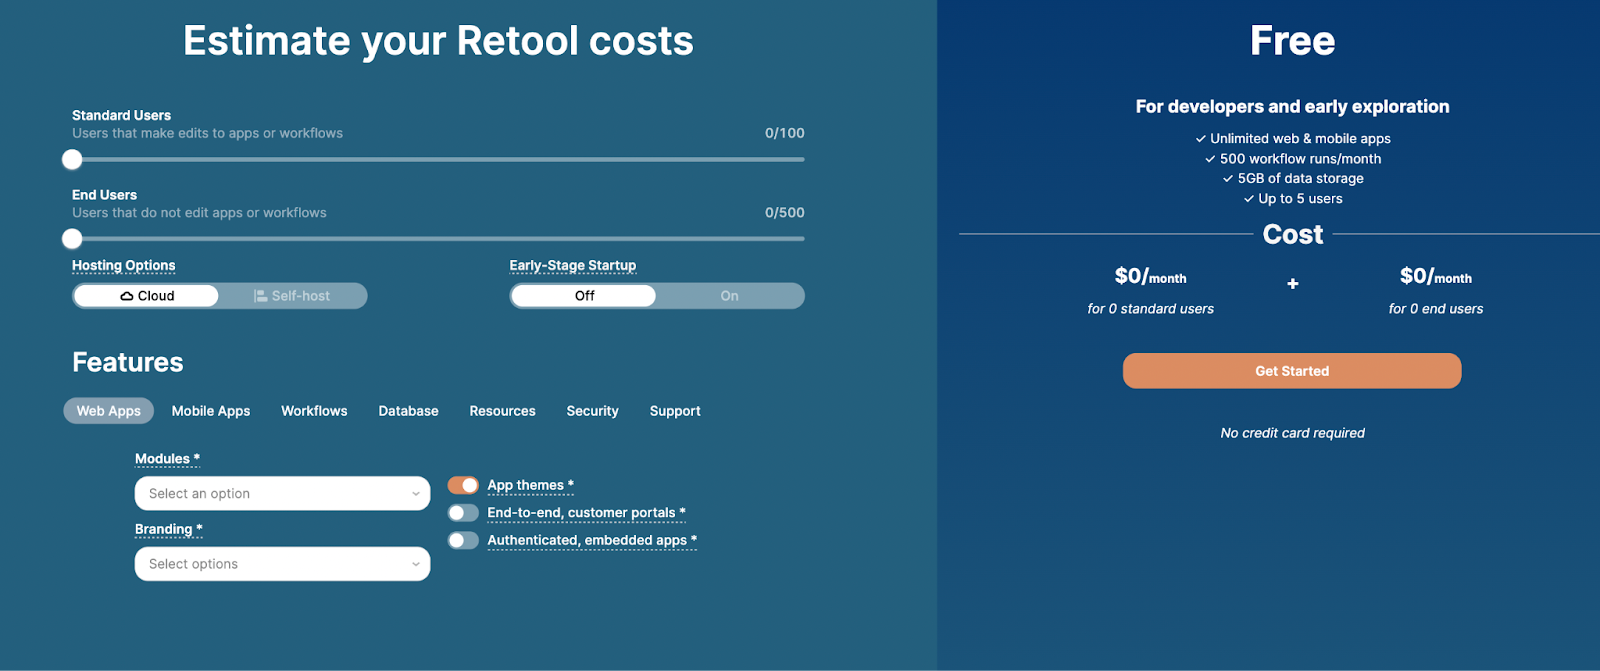
We built a Retool Pricing calculator to help our clients and new customers understand their potential monthly and annual costs of using Retool or upgrading. It has some quite complex UX/UI features that were simple to build in Retool. In this tutorial, we’ll show you how.
You can play around with the public calculator here.
With a little JavaScript, you can use this base to develop products such as:
- Business loan calculator
- Company valuation calculator
- Small business tax calculator
- Insurance calculator
- Sales quote generator
Getting started with Retool
First, head over to Retool to set up your account. Open up a blank Retool app from the apps page to get started.
Once you open a Retool app, you’ll see a blank canvas and a panel on the left-hand side. On that panel, you have:
- An ‘Add’ option to pull in your drag-and-drop components to build out your UI
- The component tree, which shows the app elements in more detail
- The code section, where you can set up resource queries and scripts to connect to your data
- A code search function
- The ‘State’ tab, which helps developers look deeper into the app’s code and variables
- The release/history tab to investigate past actions and processes, as well as version control
- Settings to control overarching app features
- The bottom bar also shows you versioning and release details and has a button for the debug pop out to help you fix any problems
- In the top right corner, you can preview and share your app
- Once you drag a component onto the canvas, you can manipulate its properties and functionality using the ‘Inspector’ tab
You can use Retool to connect to any resource via native integrations or API. Learn more in our What is Retool post.
 Tools Team
Building the calculator UI
Let’s start with some context for our example app. Retool has 4 pricing tiers for their customers: Free, Team, Business and Enterprise. Depending on what these companies need from Retool, certain factors push users into the next tier. The pricing calculation within each tier is based on two types of users: those who can build in Retool, and the number of end-users actually using the application.
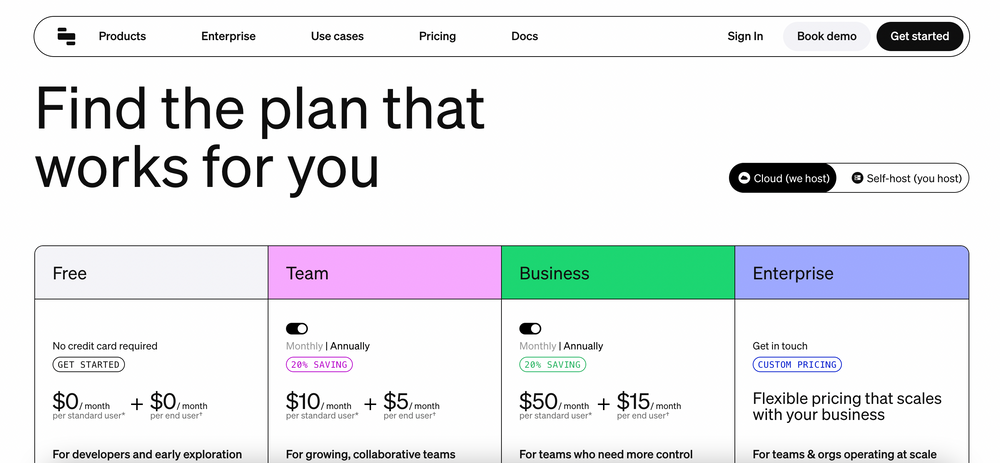
There are also a few additional features that increase the overall price, such as additional workflow runs, and there are also certain discounts available for start-ups for example. For these reasons, pricing calculations and comparisons can quickly get complicated.
To start our app, we first needed to create a UI that allows users to manipulate specific variables to adjust the pricing. We pulled in a container component to house this UI. To set the title, we added a simple text component and used markdown to format the heading size.
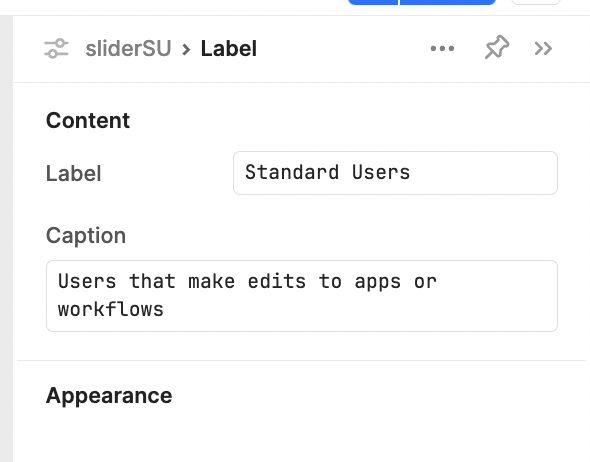
So that people can easily adjust the number of these users along a sliding scale we pulled in two Slider components.
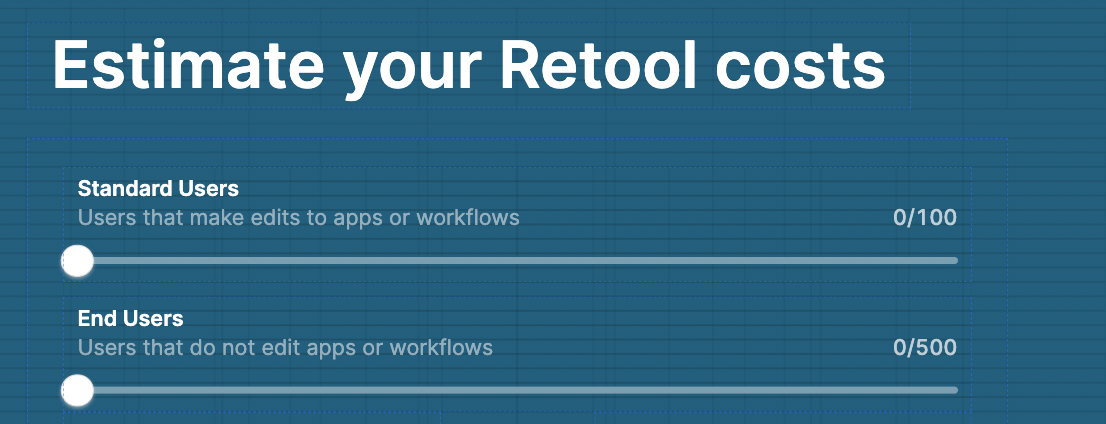
For these sliders, we set the maximum range to 100 and 500, respectively, and the step size to 1.
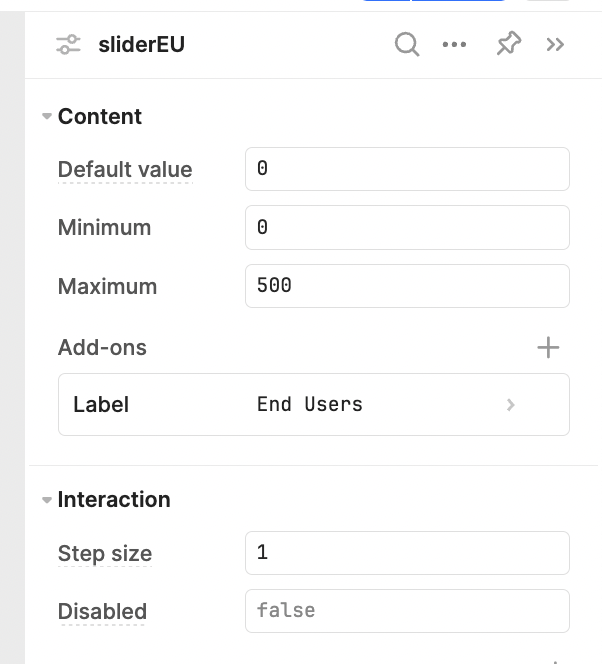
We labeled them clearly and added an explanatory caption to guide users.
There are two more essential features that determine the pricing tier for businesses: whether their environments are self-hosted or hosted on the Retool cloud, and whether or not they are a qualifying early-stage start-up, which means that can get started with $25k of credits.
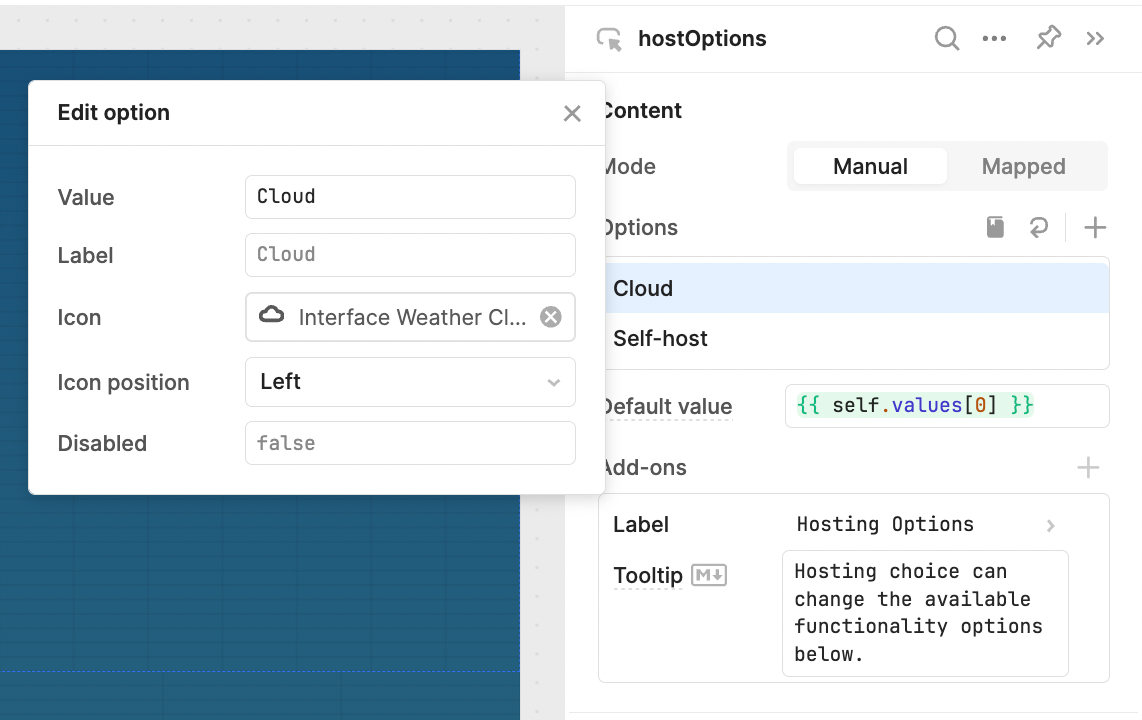
To determine this, we added two ‘Segmented Control’ components that switch between the two options:
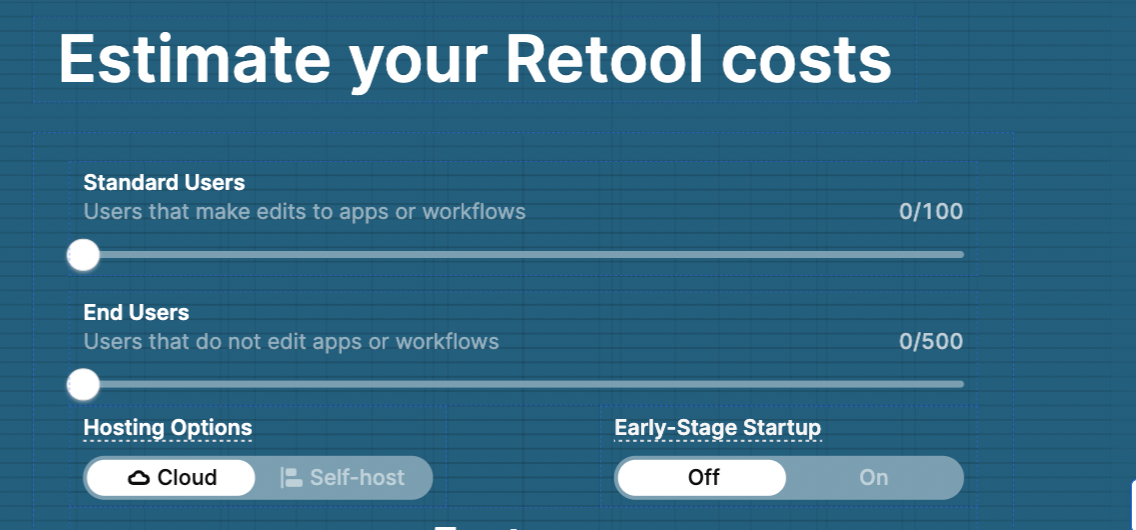
We set the dual options manually and added an icon for additional UI clarity. We used the ‘Add-on’ option of the component to set a Tooltip, which explains the functionality when they hover over the text ‘Hosting options’. This is a great way to ensure intuitive UI when building for users who may not always be familiar with functionality, as is our case for a public-facing app.
Next, we needed our users to be able to toggle functionality for the various features on a more granular level. Since these features are split into several main categories, it made sense to use a tabbed container component to separate these options into the 7 categories of function.
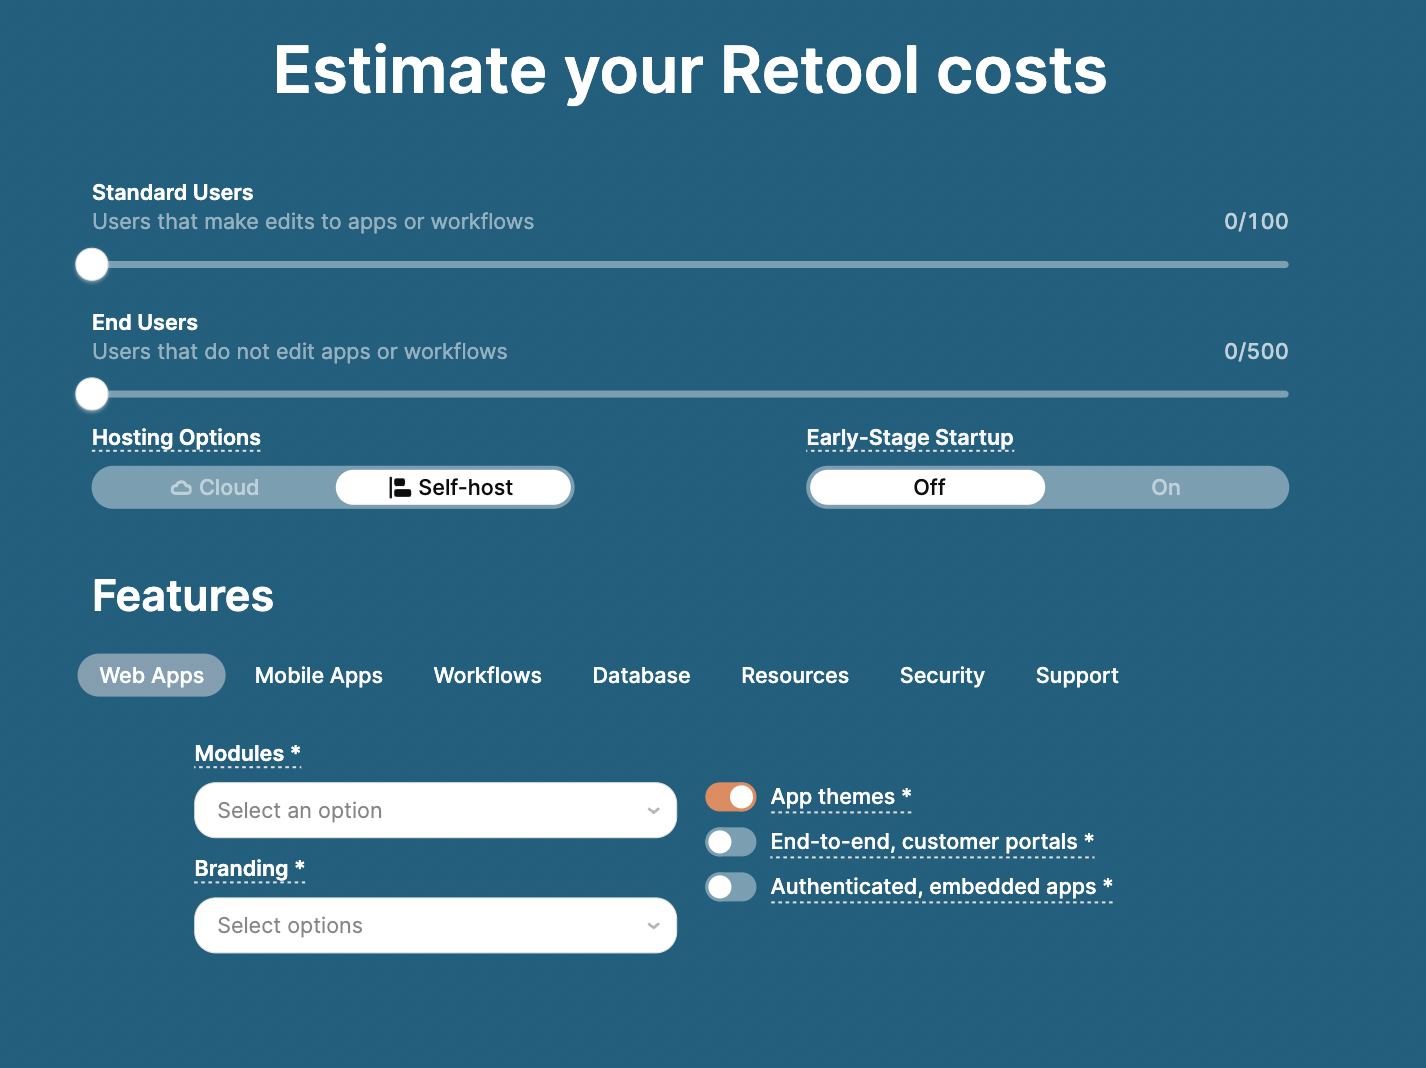
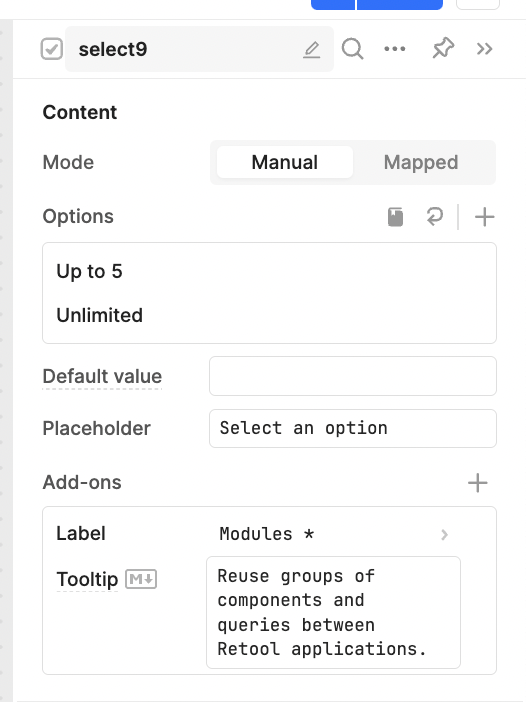
For certain options, such as ‘Modules’ or ‘Branding’, more than one option was available, so we wanted a dropdown option. We set these up using the Select component. Like with the segmented control, we programmed the options manually and added a tooltip to explain each feature:
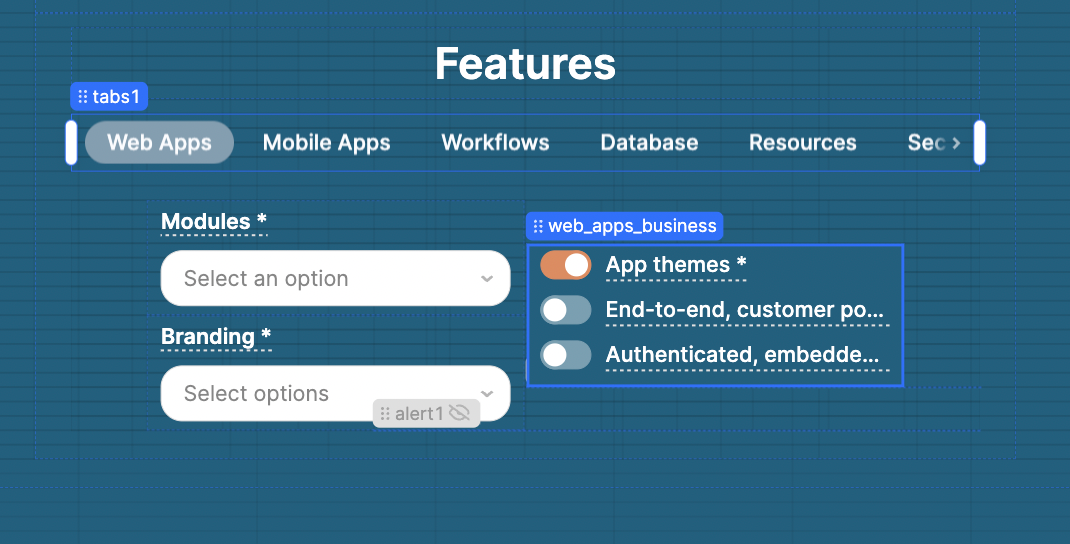
The next step was to set up our toggle options. Since certain functionality options trigger customers to upgrade or downgrade plans, we grouped the plan functionality toggles into switch group components. This made our plan calculation script much simpler.
As a specific example, under ‘web apps’, all three toggle options push the user into the ‘Business’ tier when chosen, and so we grouped them together into a group switch. This means that our ‘plan’ script only needs to check the group, rather than all components in the app.
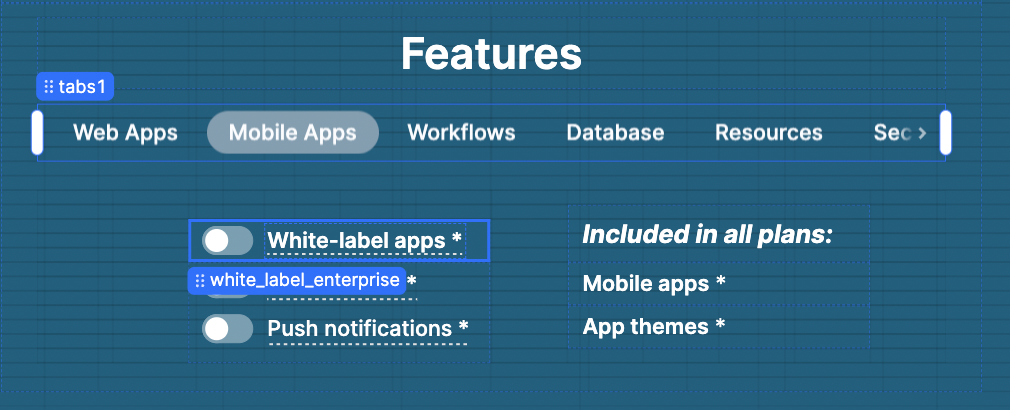
Under the ‘Mobile apps’ tab, however, white-labeled apps are an Enterprise feature, while push notifications and offline mode are Business features, so we put them in different switch groups.
We labeled each of these switch groups by their functionality and by their plan type so that we can later refer to them clearly in the JavaScript query which defines our plan tier.
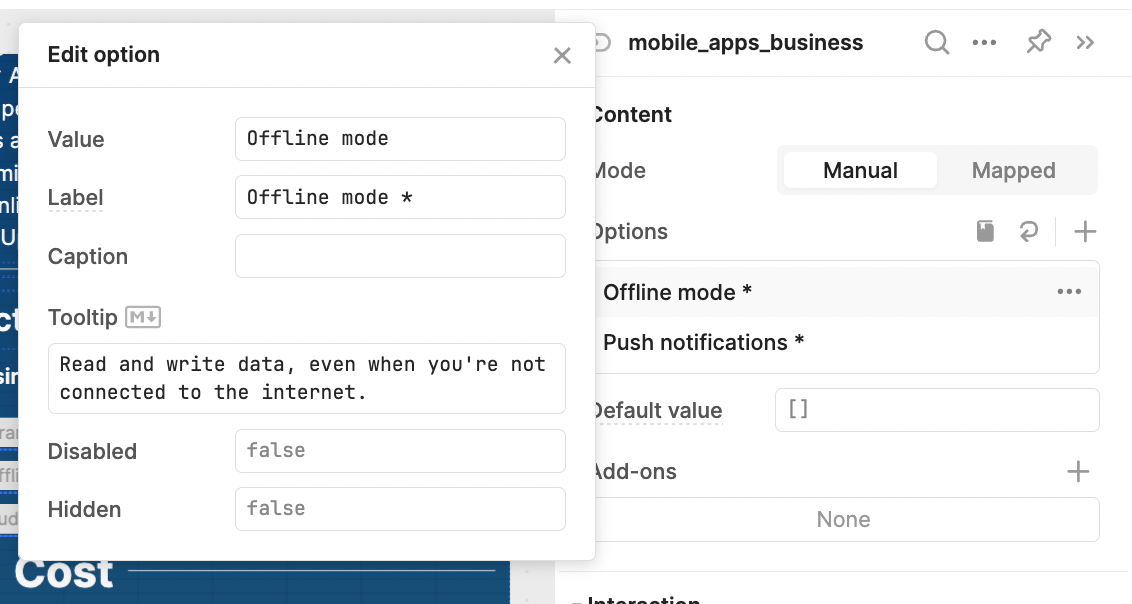
To ensure a better UX, we then set up the toggle settings with tooltip information under the Switch Group component settings.
For each other functionality tab, we repeated this process, adding select components (dropdowns) where needed, and toggles grouped in Group Switch component for all other functionality.
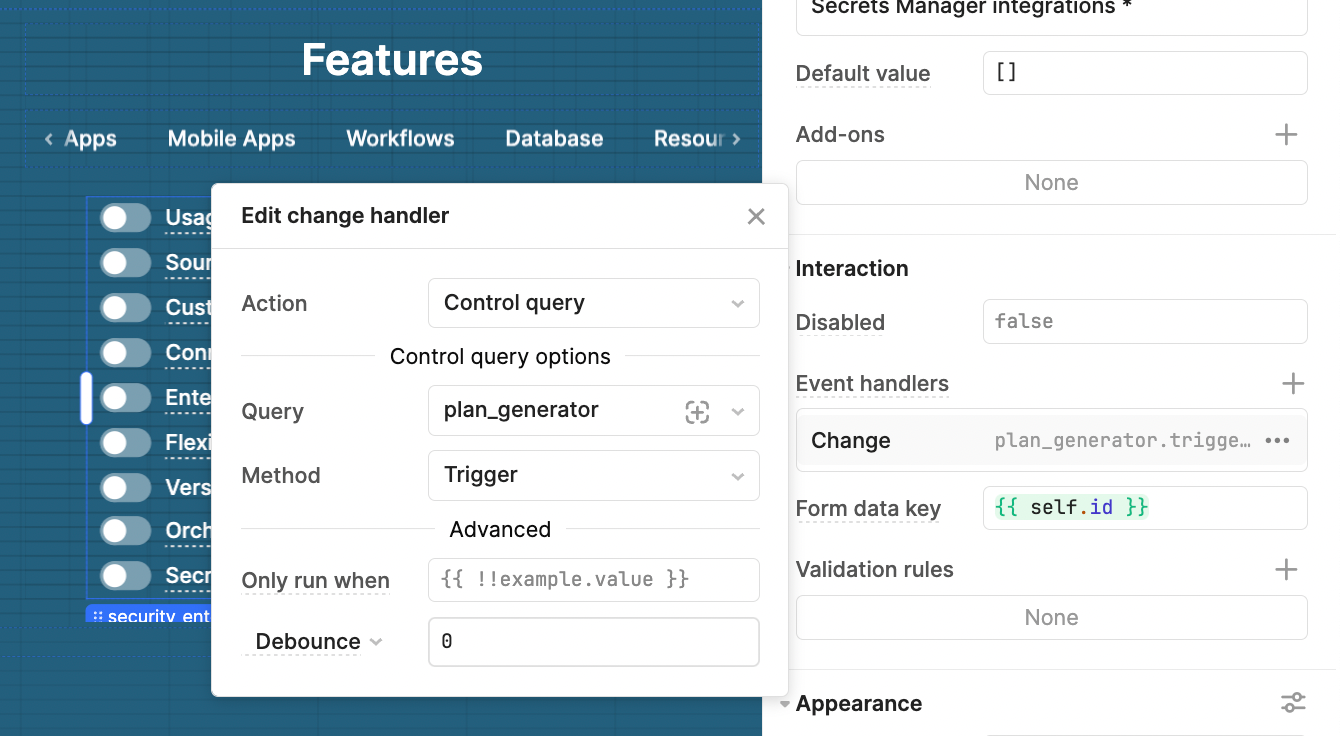
To connect all the functionality to a JavaScript query, within each Switch Group, there is an event handler that triggers the ‘Plan’ JS query on input change. This means that every time a Switch value is changed by the user, the ‘Plan’ will check if this has changed their plan type.
Next, let’s show you how we wrote this query to define the plan type and pricing.
Calculating the plan type with JavaScript
Under the ‘Code’ section on the left-hand panel in Retool, we added a new JavaScript query and named it plan_generator.
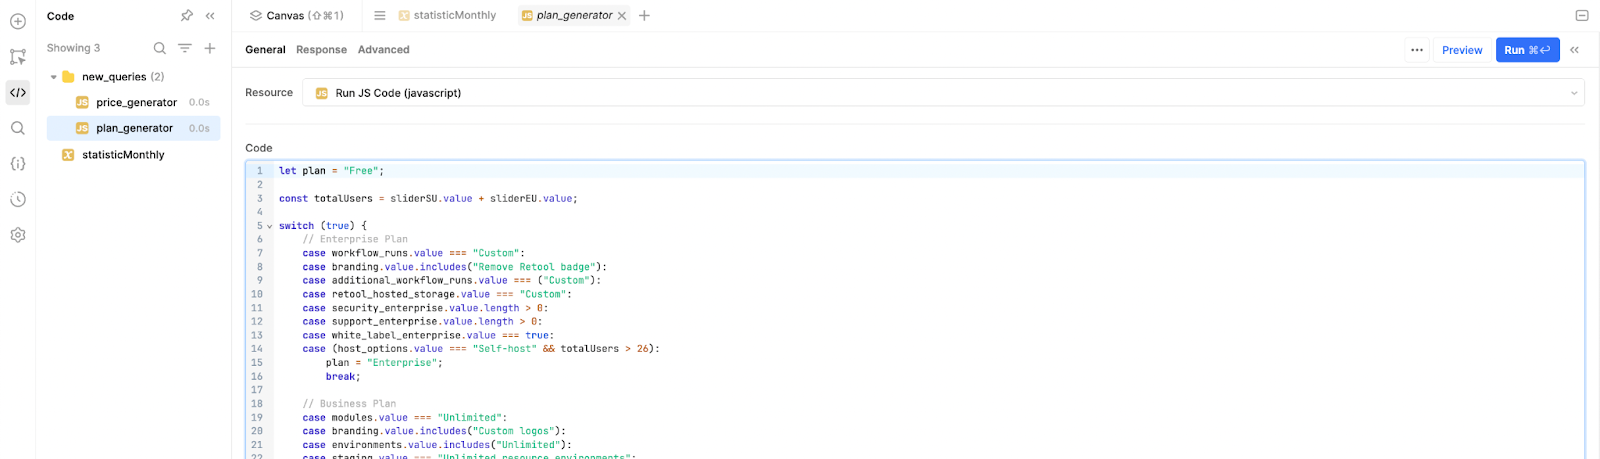
Since we grouped our toggle switches by plan type, this made it easier to check if any of those toggles in the group are checked using a switch statement (ex. case security_enterprise.value.length > 0), rather than needing to check each toggle individually. Since we set up those change handlers for the components, any time a change is made in the UI, this script will run again to check if this changes the plan.
This is what our script looked like in full:
let plan = "Free";\n\nconst totalUsers = sliderSU.value + sliderEU.value;\n\nswitch (true) {\n // Enterprise Plan\n case workflow_runs.value === "Custom":\n case branding.value.includes("Remove Retool badge"):\n case additional_workflow_runs.value === ("Custom"):\n case retool_hosted_storage.value === "Custom":\n case security_enterprise.value.length > 0:\n case support_enterprise.value.length > 0:\n case white_label_enterprise.value === true:\n case (host_options.value === "Self-host" && totalUsers > 26):\n plan = "Enterprise";\n break;\n\n // Business Plan\n case modules.value === "Unlimited":\n case branding.value.includes("Custom logos"):\n case environments.value.includes("Unlimited"):\n case staging.value === "Unlimited resource environments":\n case web_apps_business.value.length > 0:\n case mobile_apps_business.value.length > 0:\n case security_business.value.length > 0:\n plan = "Business";\n break;\n\n // Team Plan\n case totalUsers > 5:\n case workflow_runs.value === "5000 runs/month":\n case environments.value === "Staging & Production":\n case staging.value === "Staging and Production":\n case security_team.value.length > 0:\n plan = "Team";\n break;\n\n // Free Plan\n default:\n plan = totalUsers <= 5 ? \'Free\' : plan;\n break;\n}\n\nreturn plan;JavaScript code in Retool increases the UI for the internal application
This script first checks for all the values that would put users in the Enterprise tier, in this case:
- certain dropdown value selections,
- number of total users when on-prem, and,
- if any of the options in the group switches have been selected, such as the ‘support_enterprise’ switch group - i.e. if the group switch value is more than 1, then one of the toggles has been selected.
The script then works down through the plan tiers until the free tier, which is the default. Each section returns the plan type variable which we’ll use to present the app’s data.
Now that we have calculated which plan tier our users need, we need to present this information to them.
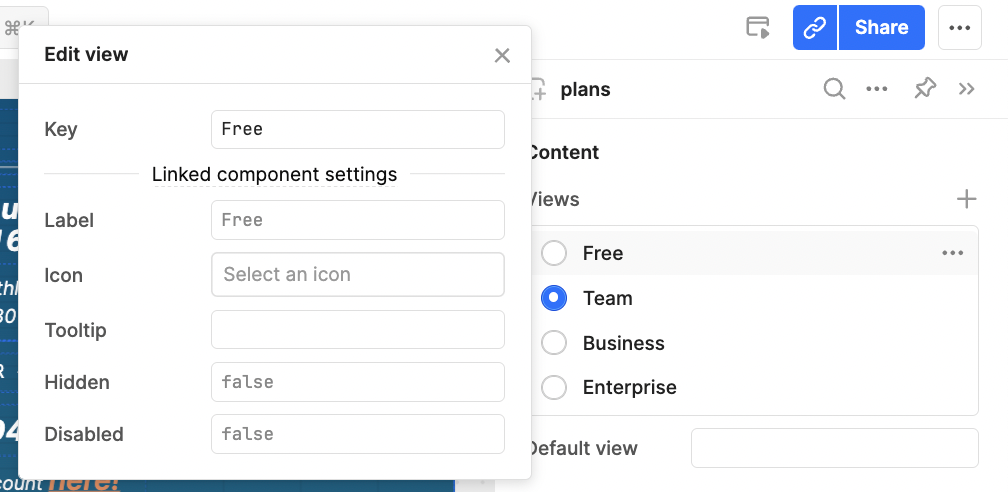
To do this, in our calculator result UI, we used 4 different ‘views’ in a tabbed container to show different information depending on the plan selected, with one tab in the container per Retool Pricing plan.
To build this, we pulled in a tabbed container component and set the four views. We then set the ‘keys’ to be the exact same value as determined in the JavaScript we wrote earlier - ‘Free’, ‘Team’, ‘Business’, or ‘Enterprise’.
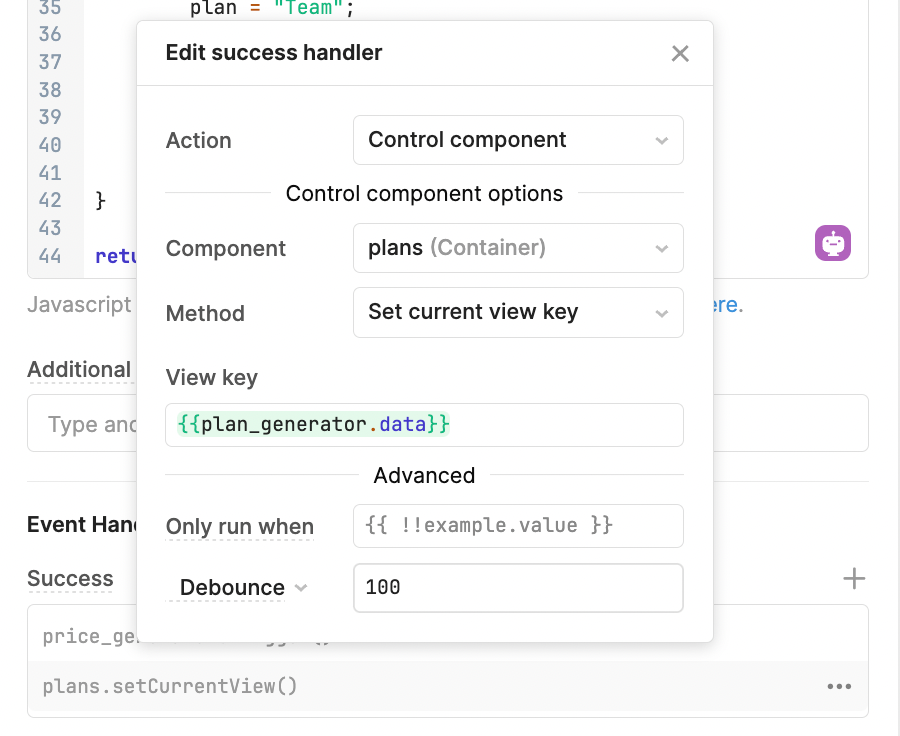
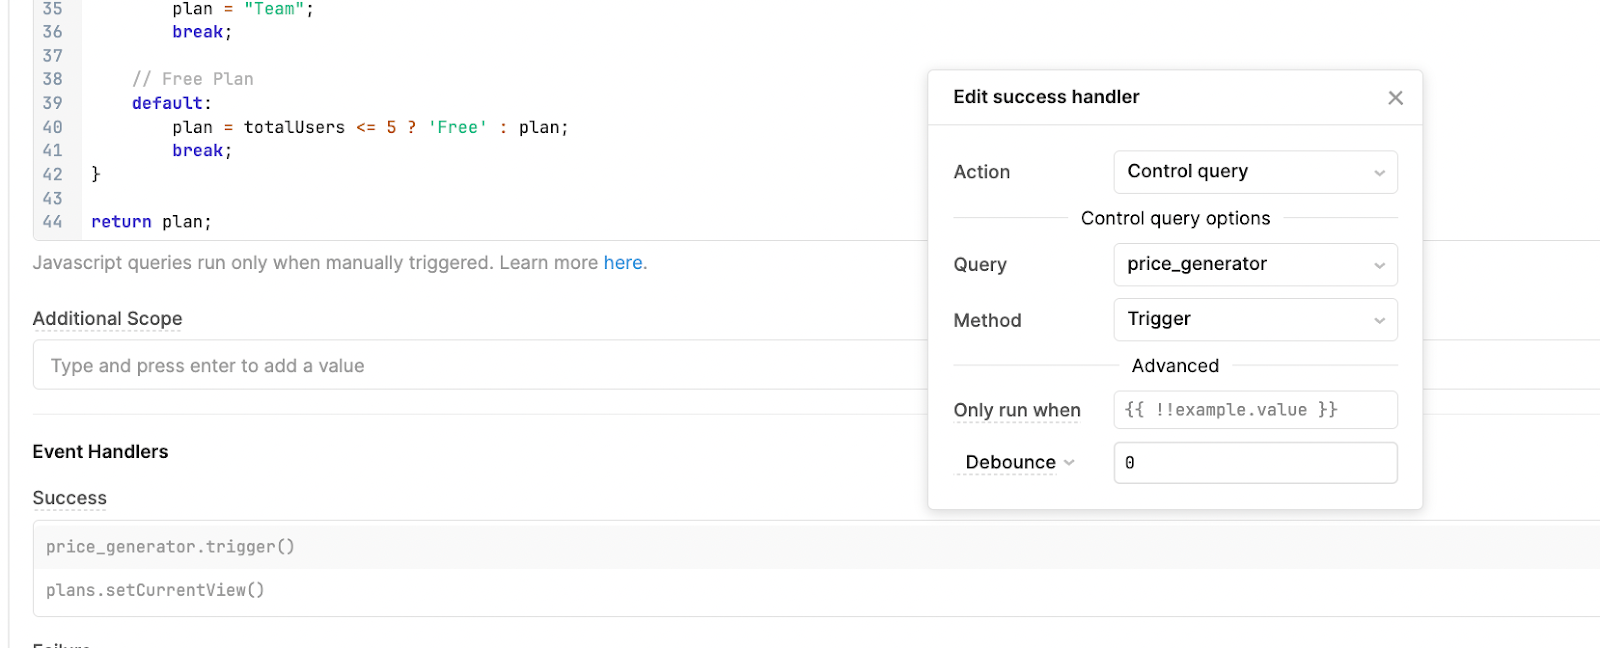
To switch the views to reflect the Plan value, we went back to the Plan JS query and added a success event handler to set the new view key for this container. Now, when the plan value changes, so does the tabbed container view respectively.
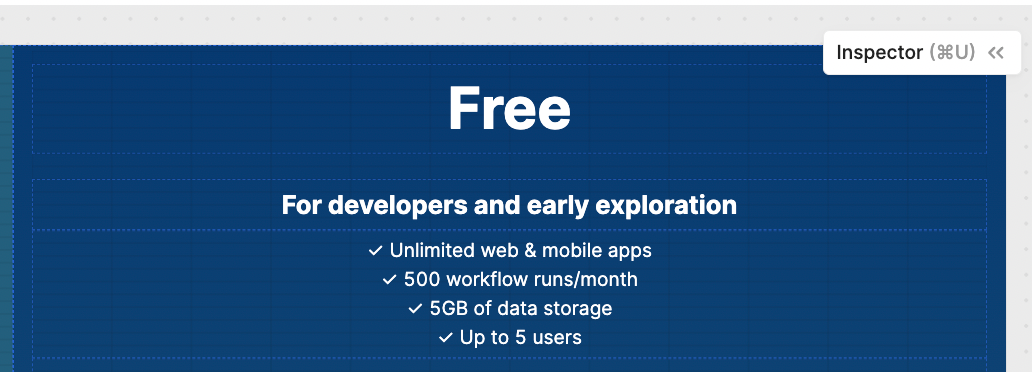
We opted to build our UI with tabbed containers rather than dynamic values since the information that is displayed is quite different for each plan type. For example, the ‘Free’ page, has a header and some text displaying the functionality included in the plan. This tab doesn’t show any pricing information as the plan is free.
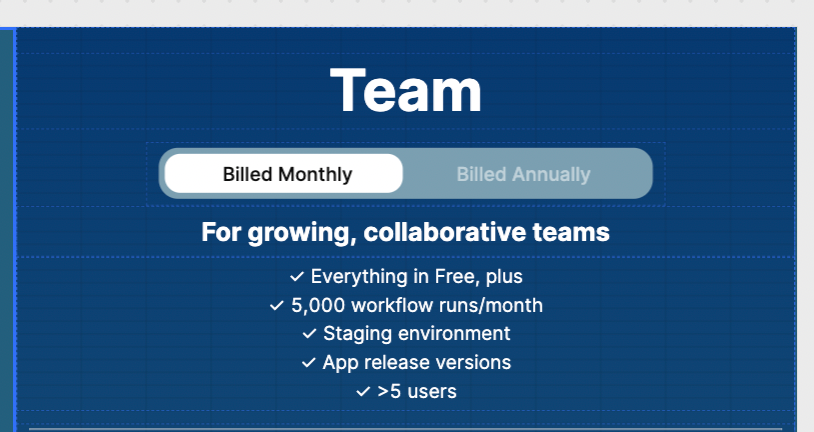
The ‘Team’ plan is slightly more complex - including another segmented control to allow users to change billing cycles, and a section that dynamically displays the selected features that pushed the user into the next plan. The business tab is the same style as the Team tab, and the Enterprise tab has specific information due to the custom pricing plan.
Next, we used the plan data, the users selected, and whether or not the user is on a monthly or annual billing cycle, to calculate the price.
Now that our plan tiers are calculated, we need to calculate and display the exact pricing for the user.
Calculating the price with JavaScript
To calculate the price, we added a new JavaScript query:
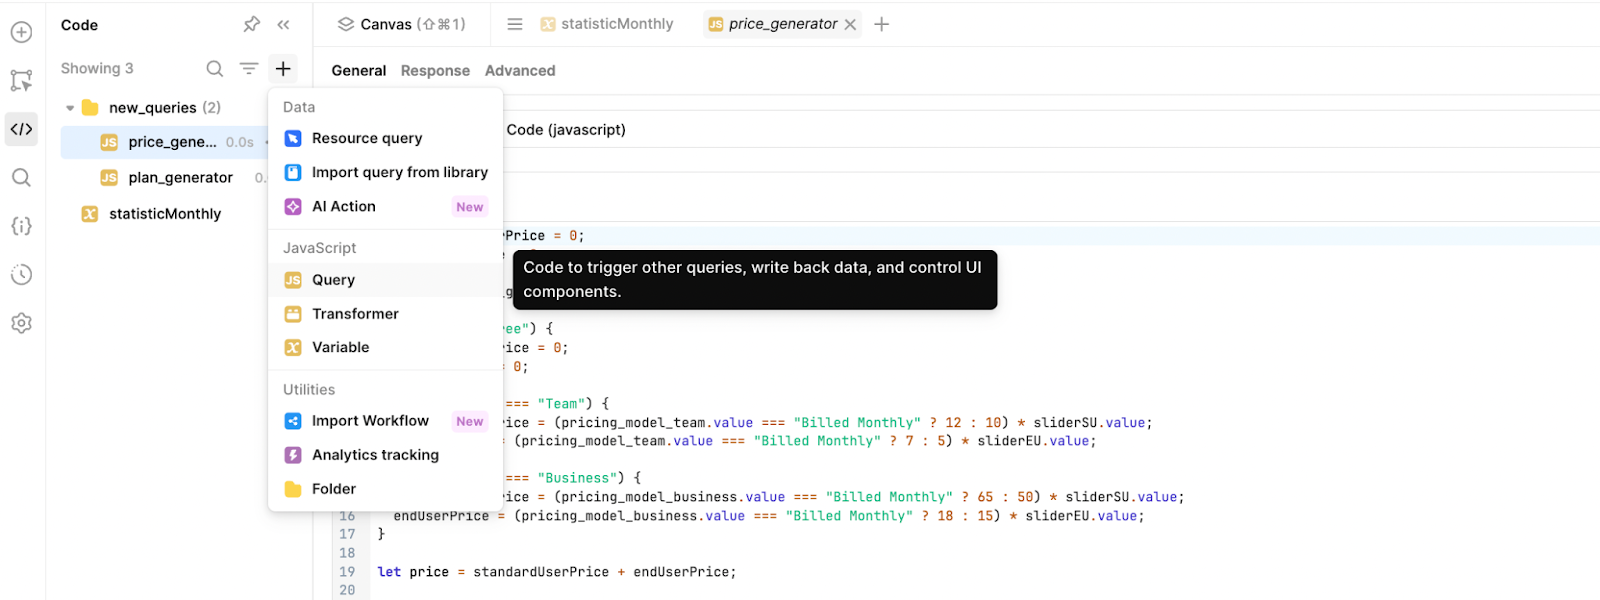
We set up the plan_generator query to trigger this next query price_generator query on success.
This is the JavaScript to calculate the Retool pricing:
let standardUserPrice = 0;\nlet endUserPrice = 0;\n\nlet plan = plan_generator.data;\n\nif (plan === "Free") {\n standardUserPrice = 0;\n endUserPrice = 0;\n \n} else if (plan === "Team") {\n standardUserPrice = (pricing_model_team.value === "Billed Monthly" ? 12 : 10) * sliderSU.value;\n endUserPrice = (pricing_model_team.value === "Billed Monthly" ? 7 : 5) * sliderEU.value;\n \n} else if (plan === "Business") {\n standardUserPrice = (pricing_model_business.value === "Billed Monthly" ? 65 : 50) * sliderSU.value;\n endUserPrice = (pricing_model_business.value === "Billed Monthly" ? 18 : 15) * sliderEU.value;\n}\n\nlet price = standardUserPrice + endUserPrice;\n\nlet totalCost = price + additional_workflow_runs.value;\n\nstatisticMonthly.setValue(totalCost);\n\nreturn {\n standardUserPrice,\n endUserPrice,\n totalCost\n};JavaScript to calculate Retool\'s pricing
This code first calculates the prices based on the plan type, the amount of each type of user, and whether or not monthly billing or annual billing has been selected. It then adds the cost of the standard and end users together and adds any additional workflow costs. The script returns the total cost, and alongside the separate values of the prices of standard and end users.
We then display these values in a breakdown in our summary section.
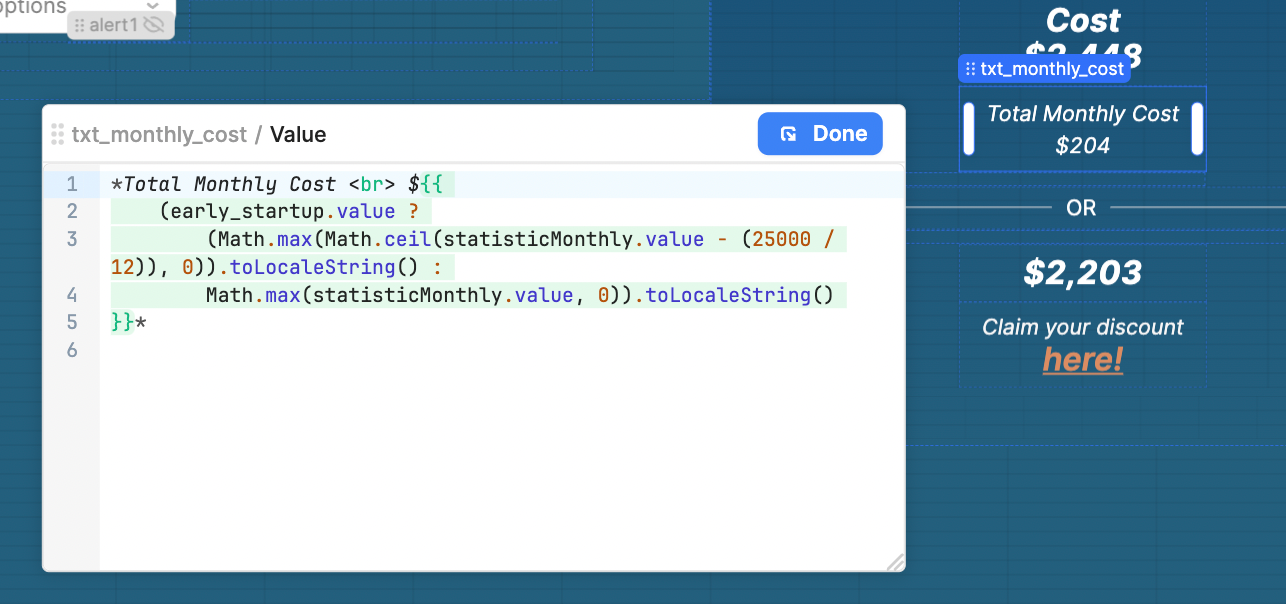
As an example, the monthly cost is displayed by referencing the standardUserPrice variable we defined in our JavaScript. We convert this value to a string so that we can add additional contextual information too, such as descriptive text and the number of standard users selected on the slider.
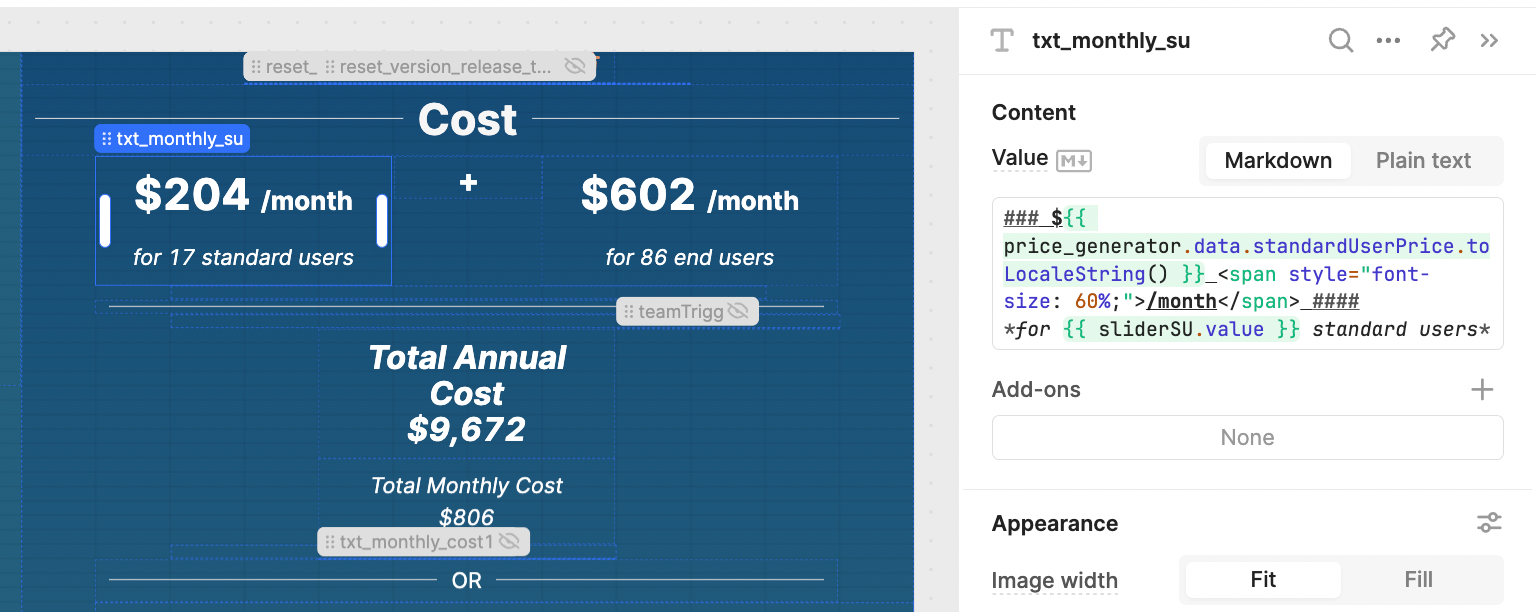
To customize the layout, we used some CSS within the component to set the “/month” to be a different size.
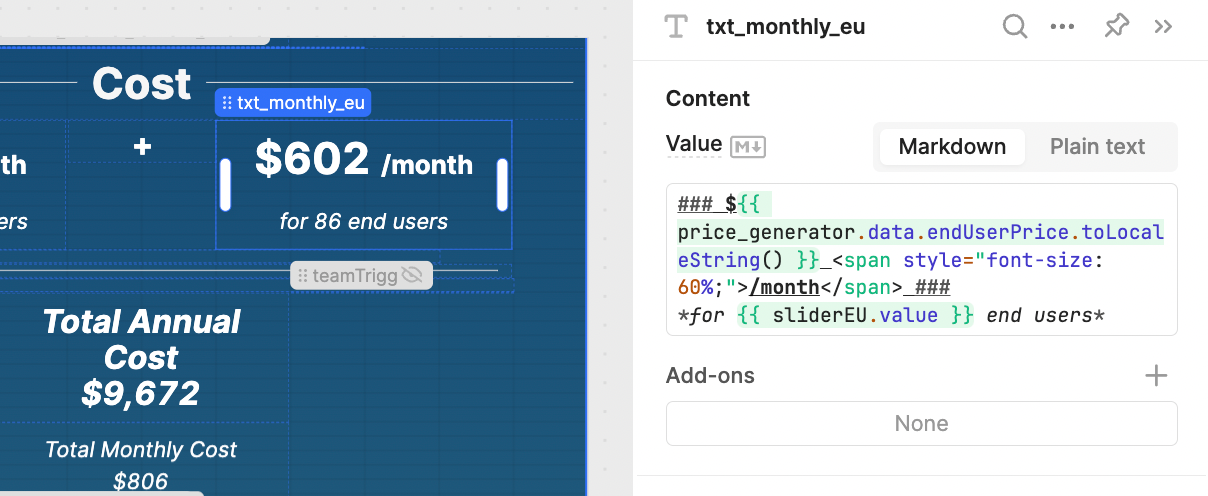
The end user cost is calculated in the same way, referring instead to the endUser variable:
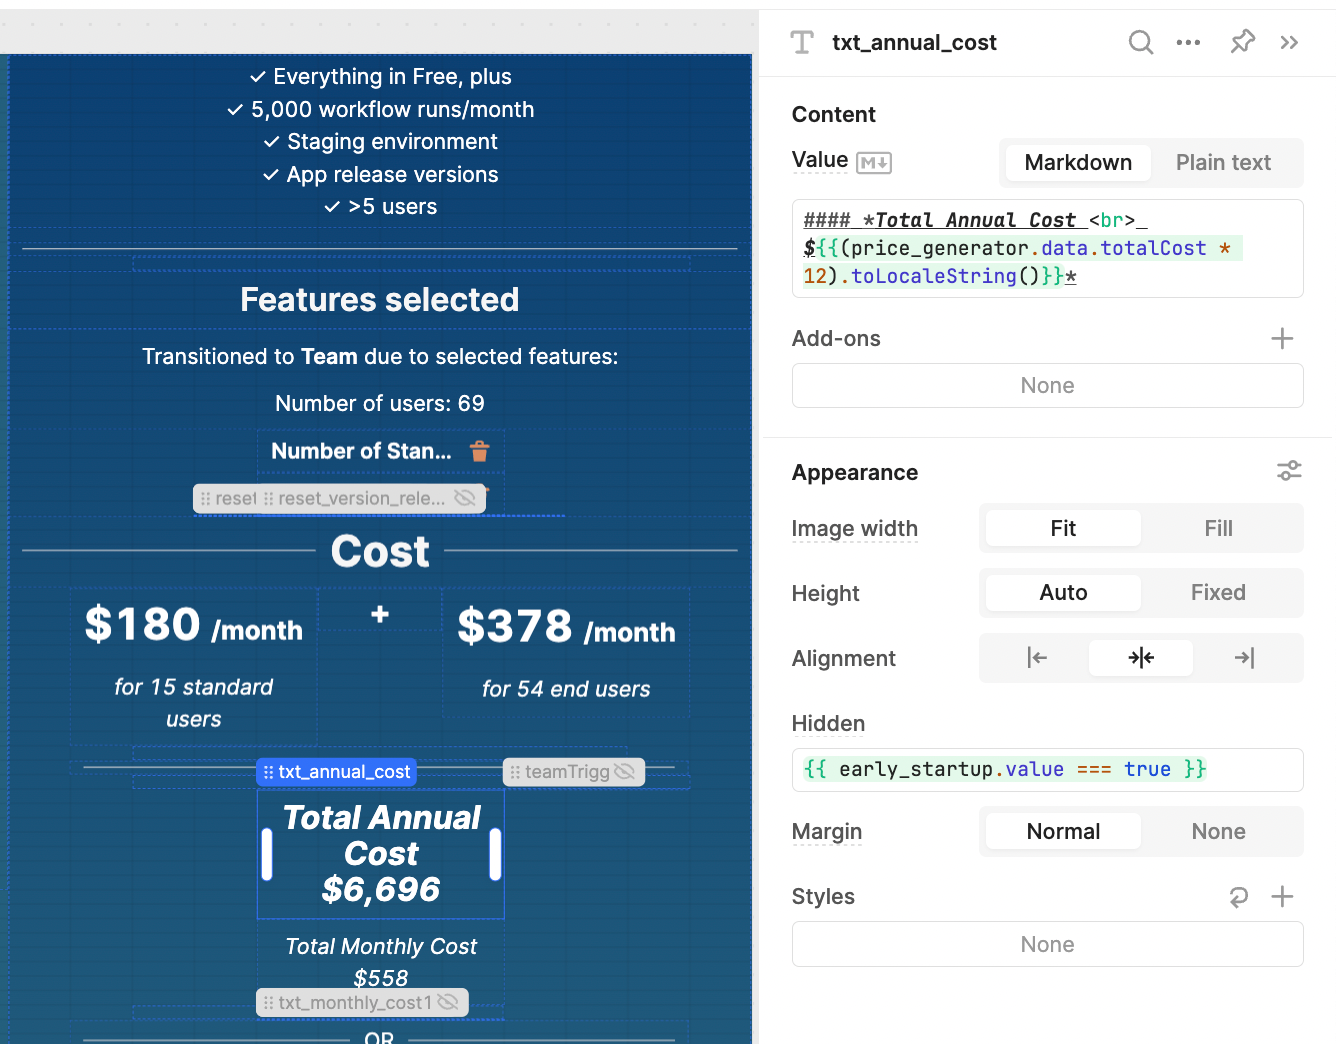
The total annual cost simply multiplies the total cost (which is calculated as the monthly cost) by 12.
The final statistic shows the total annual cost. It multiplies the total cost by 12, but has an option that also subtracts the $25,000 Retool credit if the start-up option is selected.
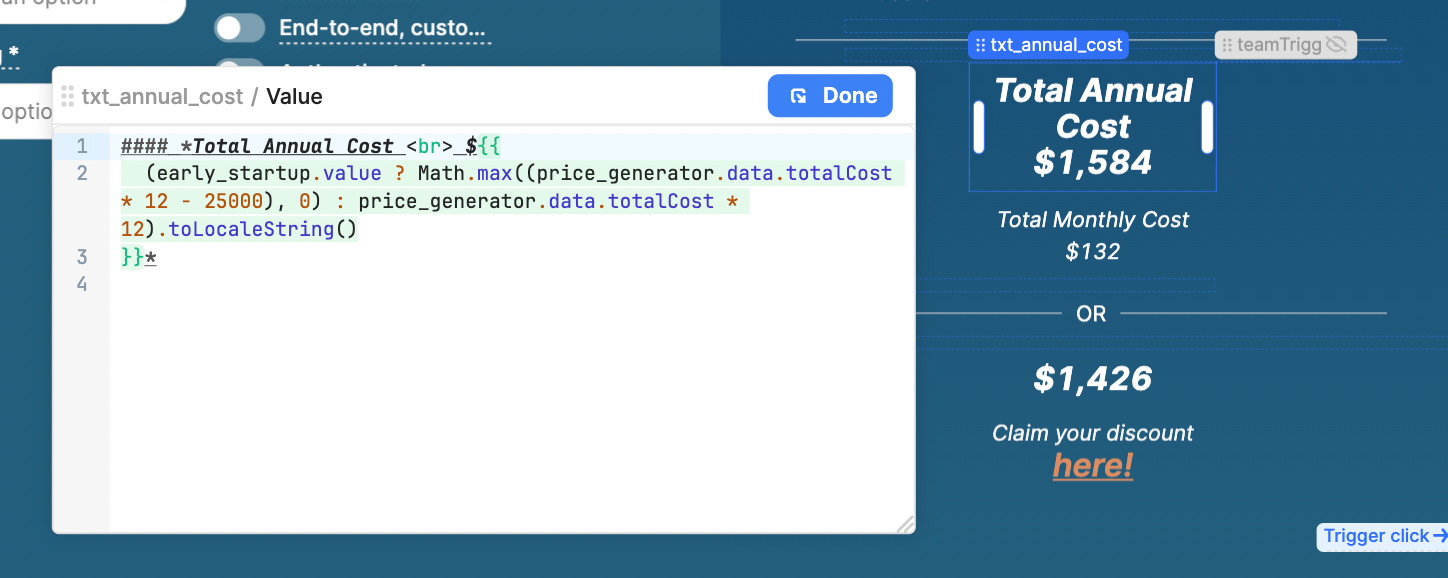
The total monthly cost takes this discount into consideration too:
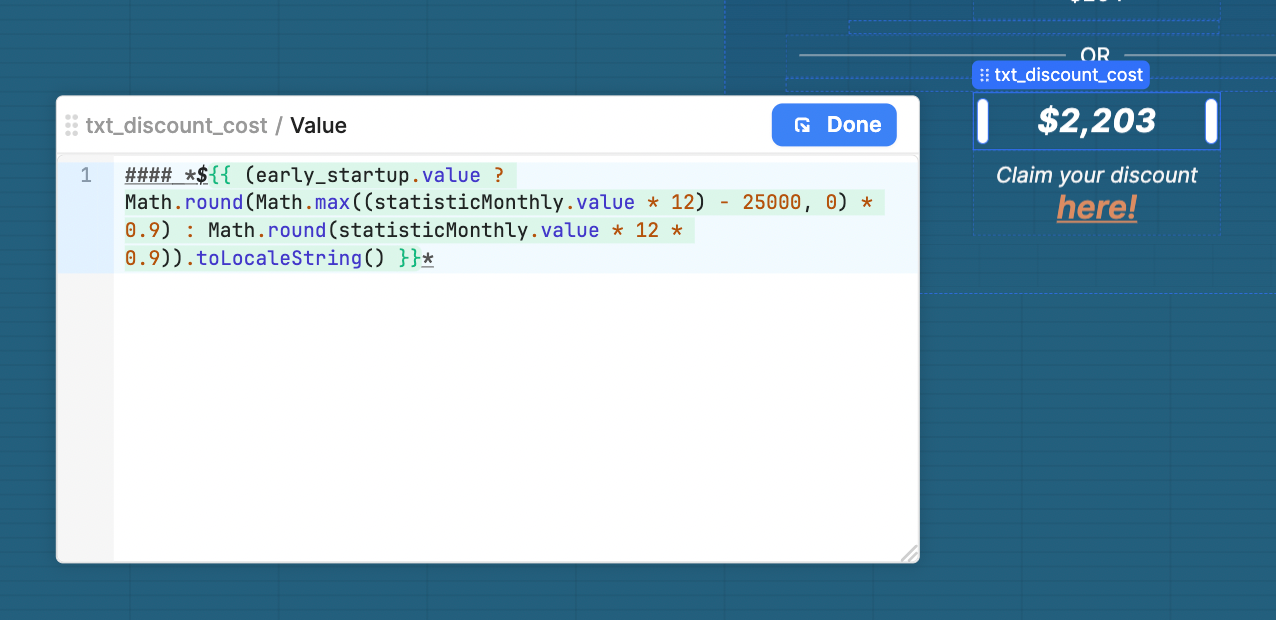
The final statistic deducts the discount of our referral code: 20% off the first 6 months, which calculates as 90% off a full year.
These statistics are the same on both the team and business plan, and change to suggest custom pricing on the Enterprise page. It’s also possible to set up this query as a JavaScript query to be reused throughout your application.
Additional UI information: displaying plan triggers
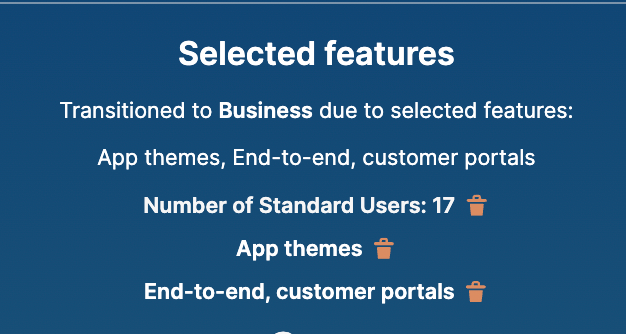
Something that is very important for a business calculator like ours, where the calculation changes depending on certain factors, is having a clear UI that shows the user what factors they selected pushed them into the next tier.
The following tutorial is not necessary for a business tutorial and is a slightly more complex addition to our calculator, but it’s a great addition for a better UX. With this functionality it makes it perfectly clear which factors have triggered a certain calculation. We made this functionality interactive, meaning that users can click the text to delete the function.
For the text, we used a series of ternaries to check if any of the options are selected. We reference the currentViewKey of the container and added the relevant functionality for the play type shown.
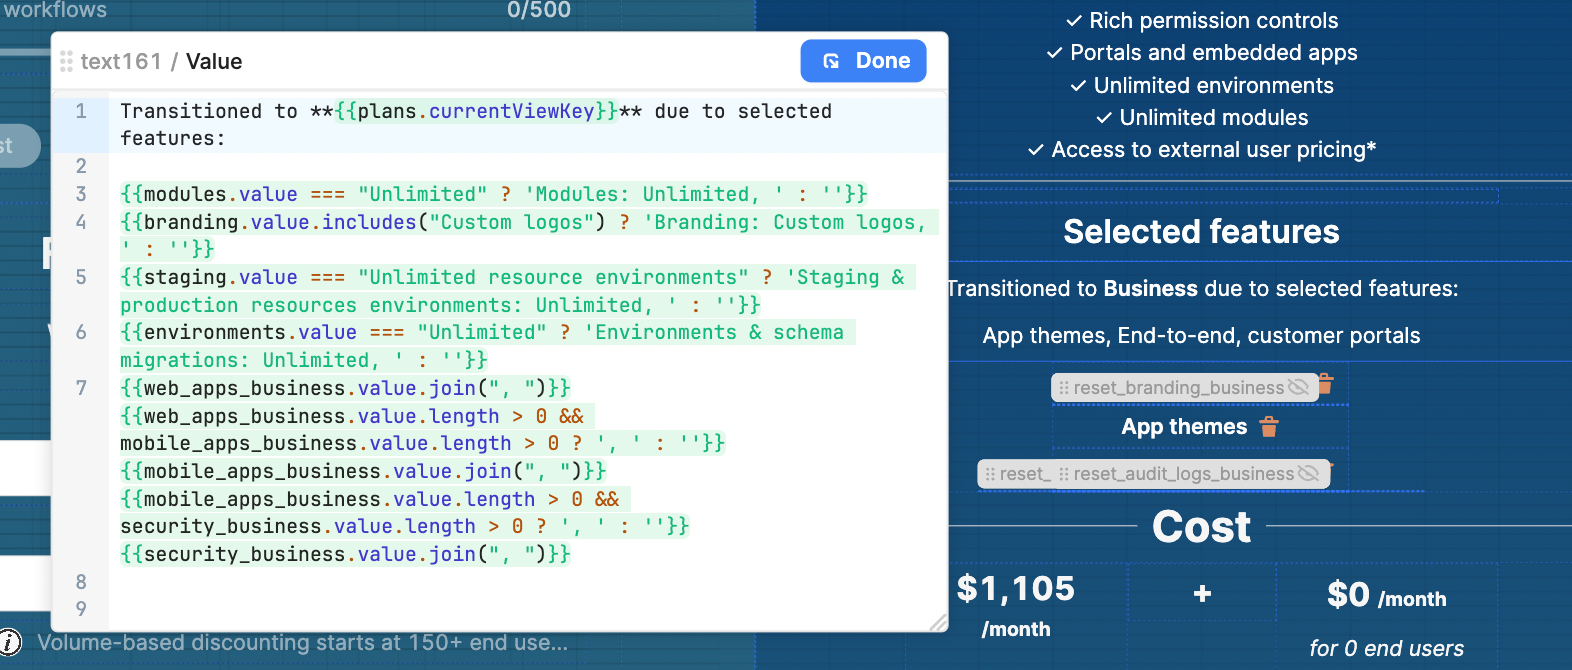
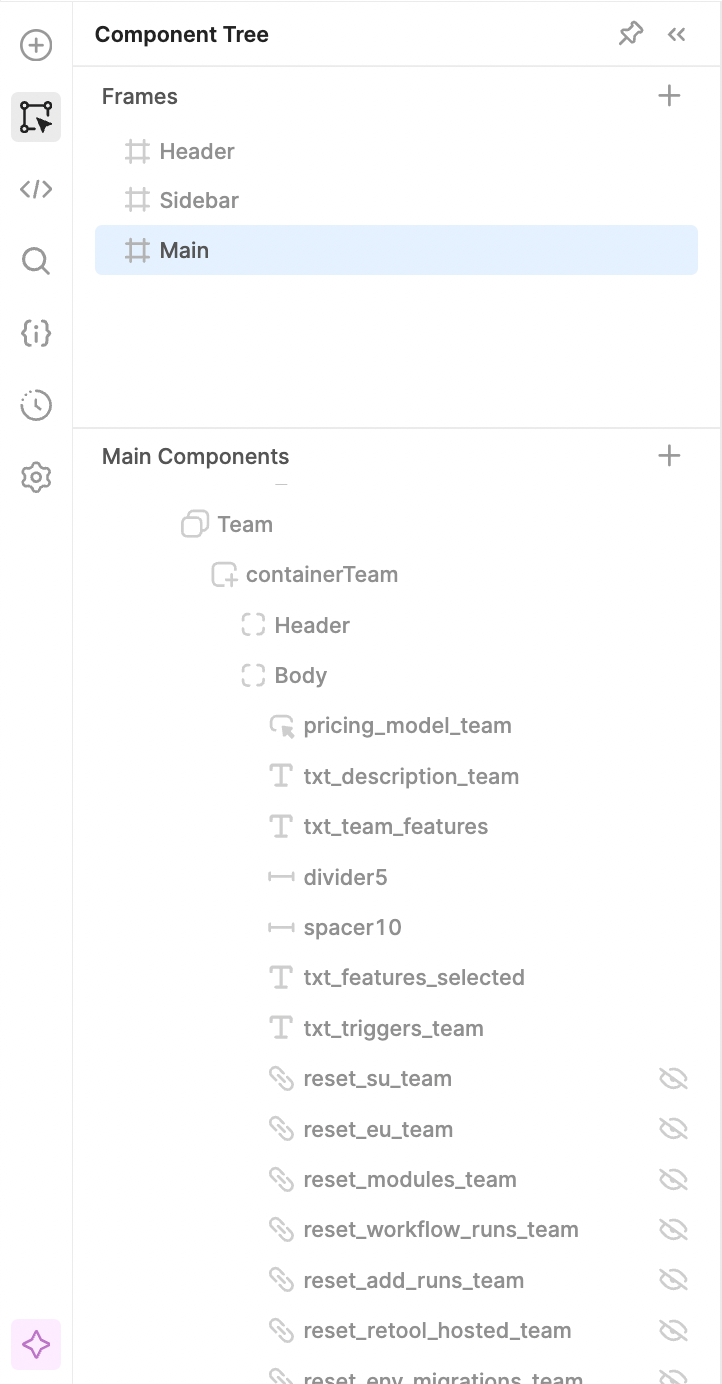
To make this interactive, for each of the options on each tier, we then added a link component and set them to hidden by default. You can see the hidden components in the component tree:
And this is how the link settings are configured:
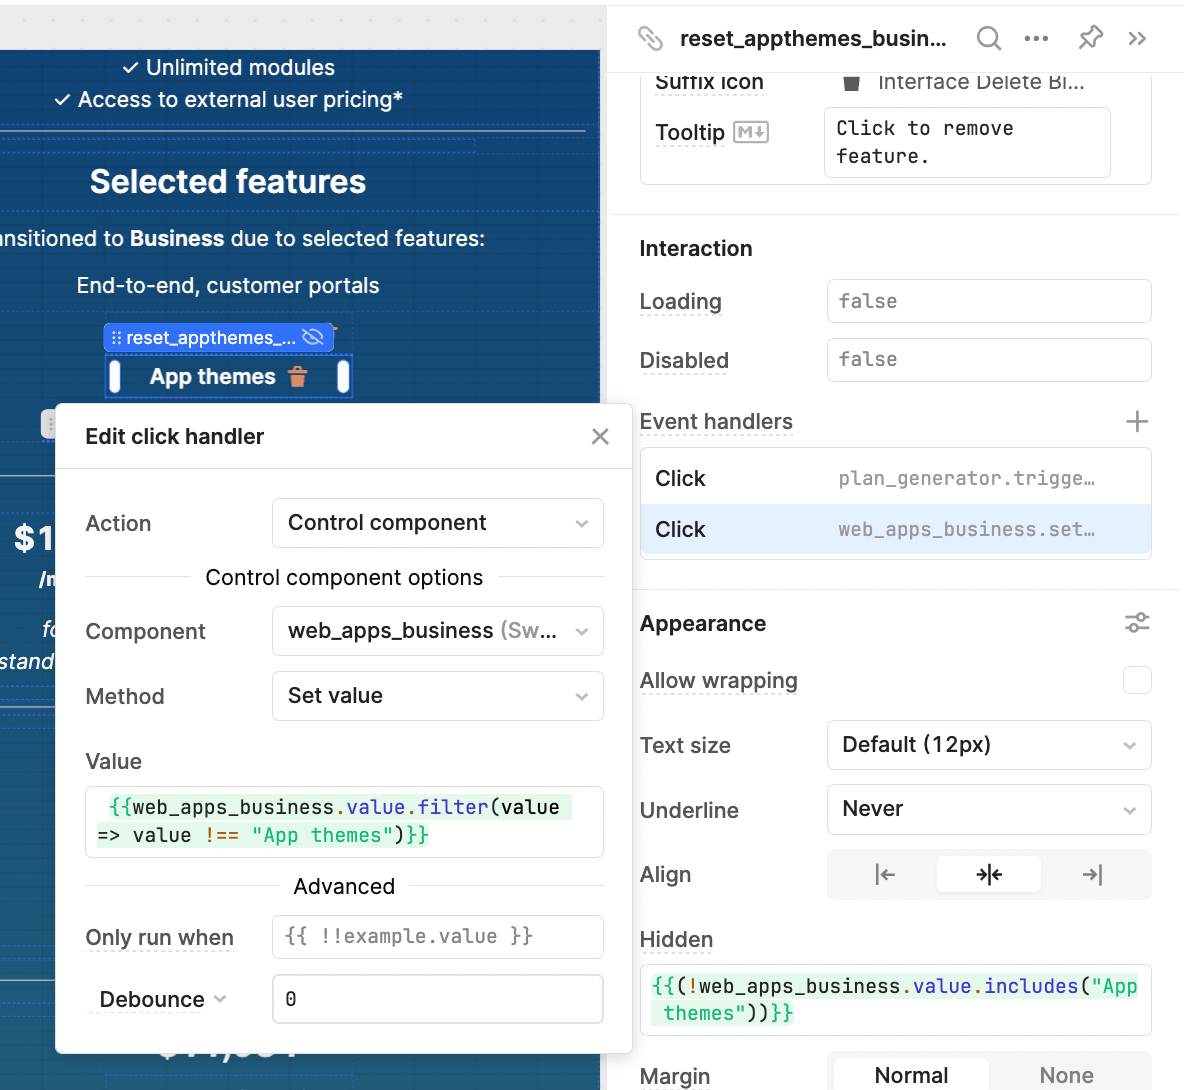
The link is set to Hidden as long as ‘App themes’ is not selected in the web_apps_business Switch Group. If that option is selected and the link shows. When the link is clicked, it triggers the ‘click handler’. The Click event handler will then set the switch value back to null.
We then have another event handler which triggers the plan_generator query to run again and check for plan changes.
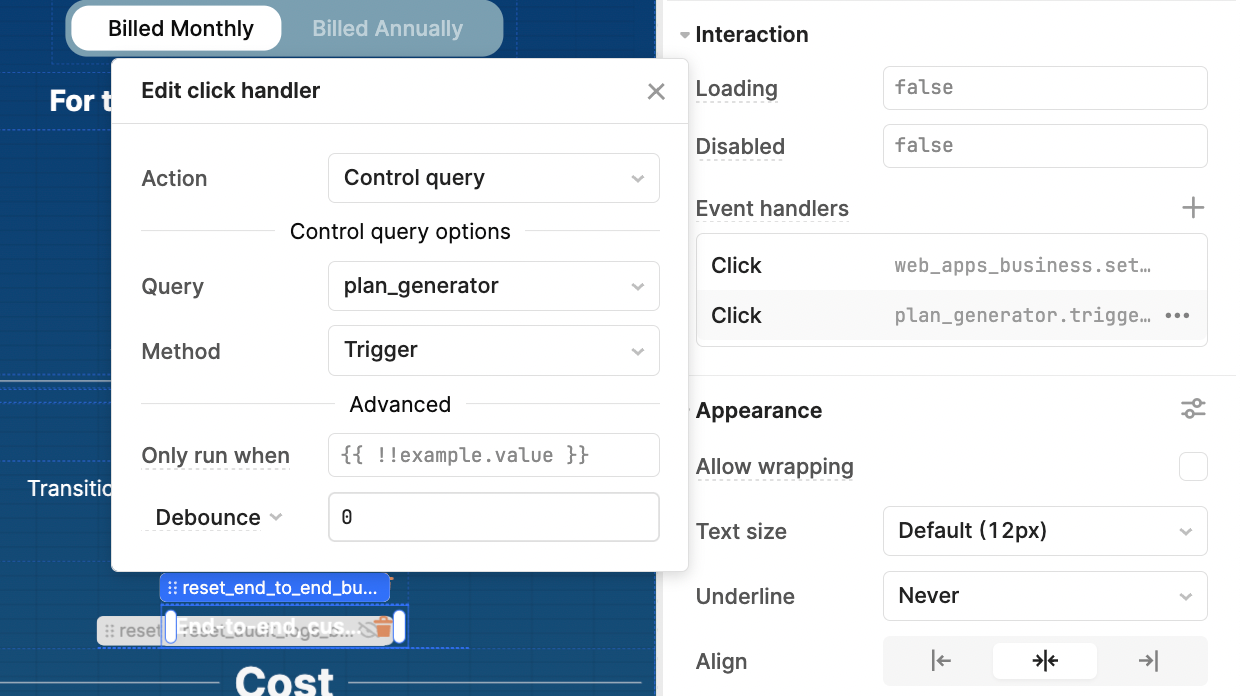
We added the same event handlers to all link components for this functionality.
Though a little more fiddly, this additional UI functionality has made it a much more user-friendly experience, where users can quickly and intuitively manipulate the variables to suit their functionality and pricing needs.
With that, we’ve shown you how we built a complex business calculator in just a few hours in Retool!
Want to learn more about internal tools and how to build them? Check out our sections on low-code tools like Notion and Airtable, or developer tools like Retool and Windmill.

