


In this tutorial, we’ll show you how to set up a map inside Retool that allows you to highlight general location boundaries using the OpenStreetMap API.
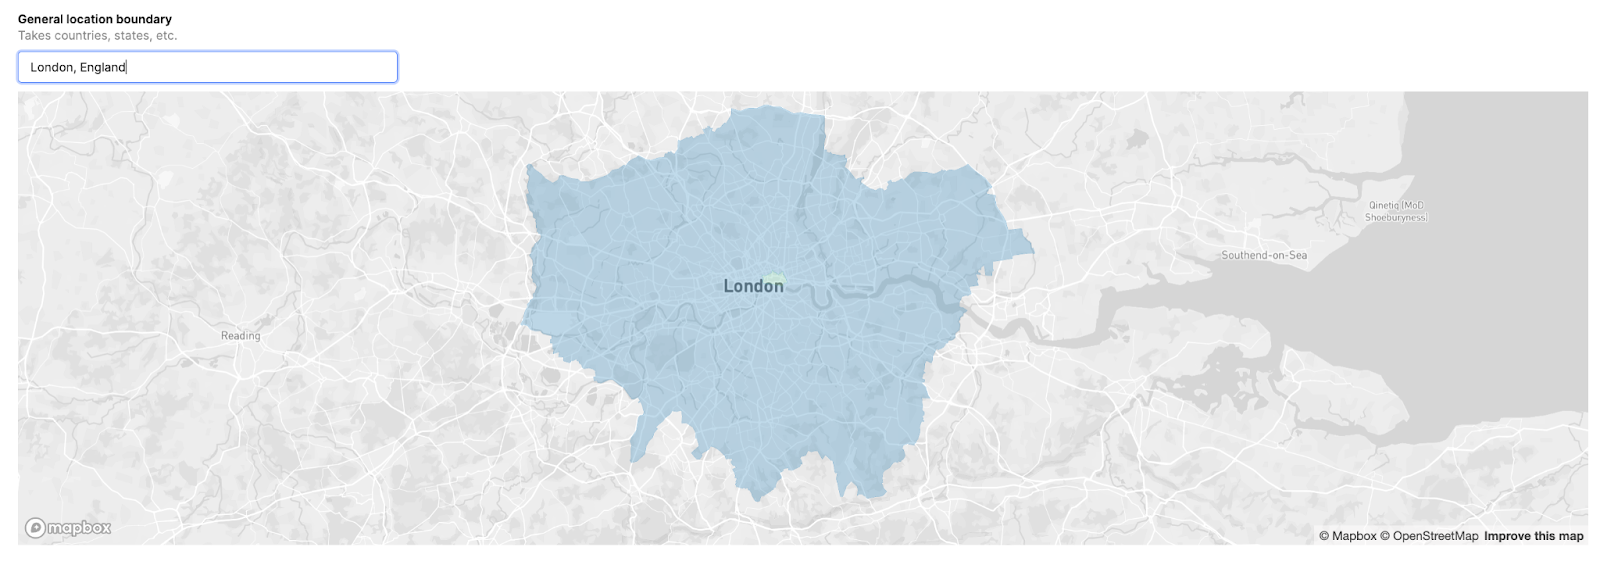
While this might seem like some highly complex functionality, in Retool it’s a 3-step process to get this up and running.
In this guide, we’ll cover how to:
- Integrate a map component within Retool.
- Use the OpenStreetMap API to fetch and display GEOJSON data based on user input.
- Define map center points and zoom levels dynamically, making the map both interactive and user-responsive.
You can play with the example app in our environment.
While we chose to use the OpenStreetMap API for this example, the ways in which we format the GEOJSON and employ the mapbox component can be extended to your own personal business usecase.
Example internal tools that could make use of the mapbox:
- Logistics teams can use maps to track real-time fleet locations in their internal tools to optimize delivery routes, and identify bottlenecks.
- In retail, store managers might employ a map in Retool to visualize customer demographics or sales data across different regions to tailor marketing strategies.
- Field service teams can assign technicians to jobs based on proximity of a Retool Mobile app, and real estate teams can analyze property locations alongside zoning or demographic data.
The Mapbox component in Retool: Pros and Cons
The native Mapbox component in Retool offers powerful capabilities for building interactive maps, giving users the ability to visualize and work with geospatial data. Built on top of the Mapbox Library, you can fully extend your applications to include complex map related workflows., you can display various map styles (such as satellite, streets, or custom themes) and overlay markers, shapes, and GEOJSON data. The component comes with some default variables and supports custom center points and zoom levels, allowing you to tailor the view based on user input or dynamic data sources.
You can also trigger interactions like clicking on map features to reveal detailed information, making it useful for use cases like visualizing real-time asset locations, plotting routes, or highlighting regions on a map. Mapbox's flexibility in Retool also extends to integrating with external APIs, enabling advanced geospatial data analysis directly within your internal tools.
The Mapbox component in Retool, while powerful, does have some limitations to consider:
- Limited customization via Retool UI: Although you can adjust aspects like center point, zoom level, and map style, more advanced Mapbox configurations—such as detailed control over map layers or specific styling options—require custom JavaScript or external configuration, which might not be fully accessible through Retool's interface alone. Though, you can implement a simple Mapbox functionality inside of Retool’s custom component to get around this limitation.
- No direct Tile layer customization: While the Mapbox component supports different map styles (e.g., streets, satellite), customizing tile layers beyond the provided Mapbox options may be challenging. You would need to implement a custom Retool component using the Mapbox to customize this yourself.
- Performance concerns: Loading large amounts of geospatial data (e.g., numerous markers or complex GEOJSON files) can affect performance, leading to slower map rendering or user experience lags, especially in applications that require real-time data updates.
Now we know a bit more about the component, let’s get started with building out our map app.
Step 1: Generating GEOJSON Data for the Map
First things first, you need data to display on your map. We’ll use OpenStreetMap's API, a robust, open-source platform that supports global location data.
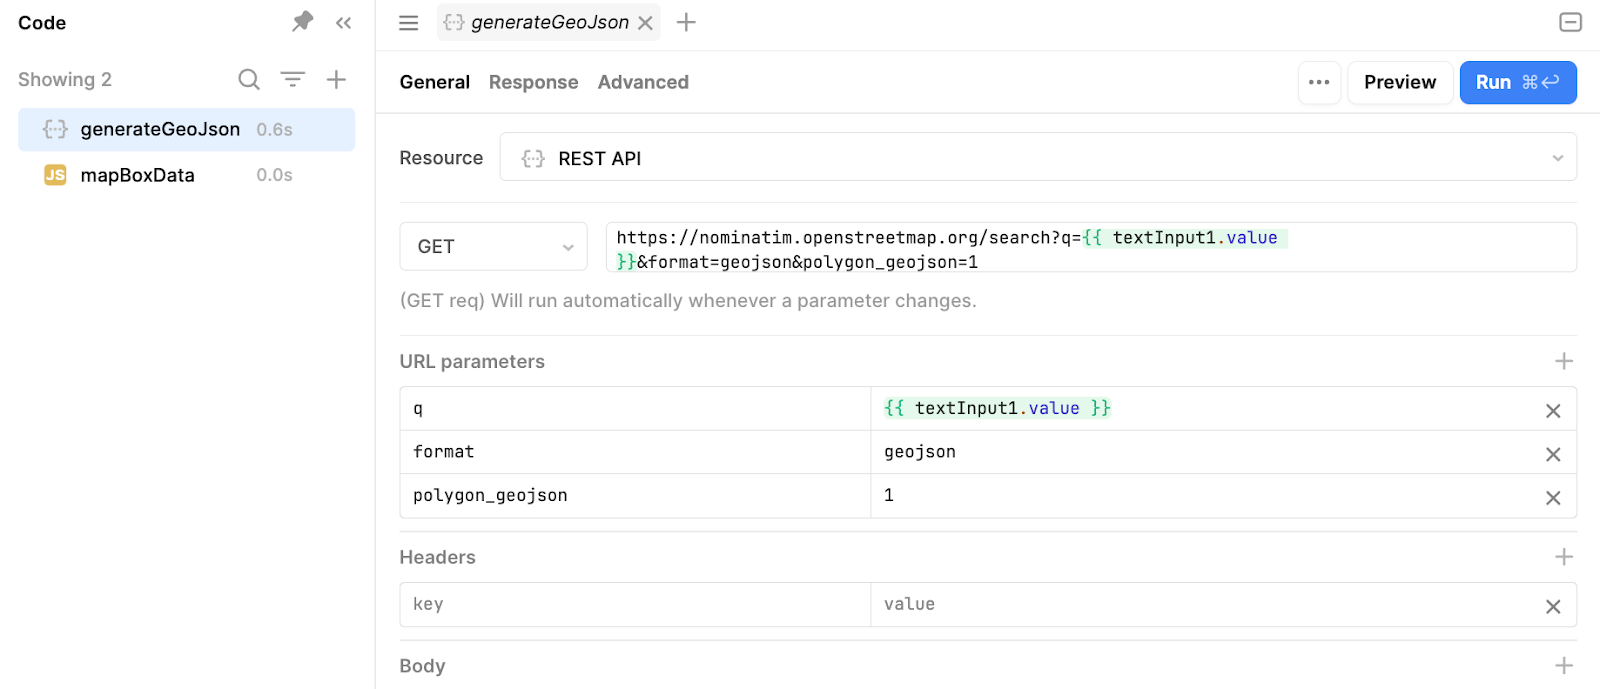
The key to getting this data is making an API call to OSM that retrieves GEOJSON data based on user input. Back in your app, first pull in a mapbox component and a text input.
Now, here’s the API call you’ll be using in Retool:
Copy code:
https://nominatim.openstreetmap.org/search?q={{ textInput1.value }}&format=geojson&polygon_geojson=1Code example for API call to OpenStreetMap, retrieving GEOJSON data for map visualization
The query (q) parameter will be linked to a text input box in your Retool app ({{ textInput1.value }}). The response format is set to GEOJSON, which will give us the data we need to display location information on the map. polygon_geojson=1 ensures that we also receive polygon data, which is important for visualizing boundaries and areas on the map.
You can now use this GEOJSON response to start building your map.
Next we’ll show you how we set the latitude and longitude for the center point.
Step 2: Defining the Center Point and Zoom Level
The next step is to dynamically set the map's center point and zoom level in the Mapbox component. This ensures that the map displays the location based on what the user inputs.
To achieve this, you’ll need a JavaScript query in Retool. Now, the code for this is fairly complex, but luckily for you we’ve sorted that out for you already:
Here’s the full JS query:
var geojson = generateGeoJson.data
function calculateBoundingBox(geojson) {
let minLat = Infinity, maxLat = -Infinity;
let minLng = Infinity, maxLng = -Infinity;
geojson.features.forEach(function(feature) {
const coords = feature.geometry.coordinates;
if (feature.geometry.type === "Point") {
const [lng, lat] = coords;
if (lat < minLat) minLat = lat;
if (lat > maxLat) maxLat = lat;
if (lng < minLng) minLng = lng;
if (lng > maxLng) maxLng = lng;
} else if (feature.geometry.type === "Polygon") {
coords[0].forEach(function([lng, lat]) {
if (lat < minLat) minLat = lat;
if (lat > maxLat) maxLat = lat;
if (lng < minLng) minLng = lng;
if (lng > maxLng) maxLng = lng;
});
}
});
return {
southwest: [minLng, minLat],
northeast: [maxLng, maxLat]
};
}
// Function to calculate the center point
function calculateCenter(bounds) {
const centerLng = (bounds.southwest[0] + bounds.northeast[0]) / 2;
const centerLat = (bounds.southwest[1] + bounds.northeast[1]) / 2;
return [centerLng, centerLat];
}
// Function to estimate zoom level based on the bounding box
function calculateZoom(bounds, mapWidth, mapHeight) {
const WORLD_DIM = { height: 256, width: 256 };
const ZOOM_MAX = 20;
function latRad(lat) {
const sin = Math.sin(lat * Math.PI / 180);
const radX2 = Math.log((1 + sin) / (1 - sin)) / 2;
return Math.max(Math.min(radX2, Math.PI), -Math.PI) / 2;
}
function zoom(mapPx, worldPx, fraction) {
return Math.floor(Math.log(mapPx / worldPx / fraction) / Math.LN2);
}
const latFraction = (latRad(bounds.northeast[1]) - latRad(bounds.southwest[1])) / Math.PI;
const lngDiff = bounds.northeast[0] - bounds.southwest[0];
const lngFraction = (lngDiff < 0 ? lngDiff + 360 : lngDiff) / 360;
const latZoom = zoom(mapHeight, WORLD_DIM.height, latFraction);
const lngZoom = zoom(mapWidth, WORLD_DIM.width, lngFraction);
return Math.min(latZoom, lngZoom, ZOOM_MAX);
}
// Calculate the bounding box
const bounds = calculateBoundingBox(geojson);
// Calculate the center point of the bounding box
const center = calculateCenter(bounds);
// Calculate zoom level (for example, assuming a map size of 800x600 pixels)
const mapWidth = 800;
const mapHeight = 600;
const zoomLevel = calculateZoom(bounds, mapWidth, mapHeight);
return {'center':center, 'zoomLevel':zoomLevel}
JavaScript code for setting map center points and zoom levels dynamically in Retool.
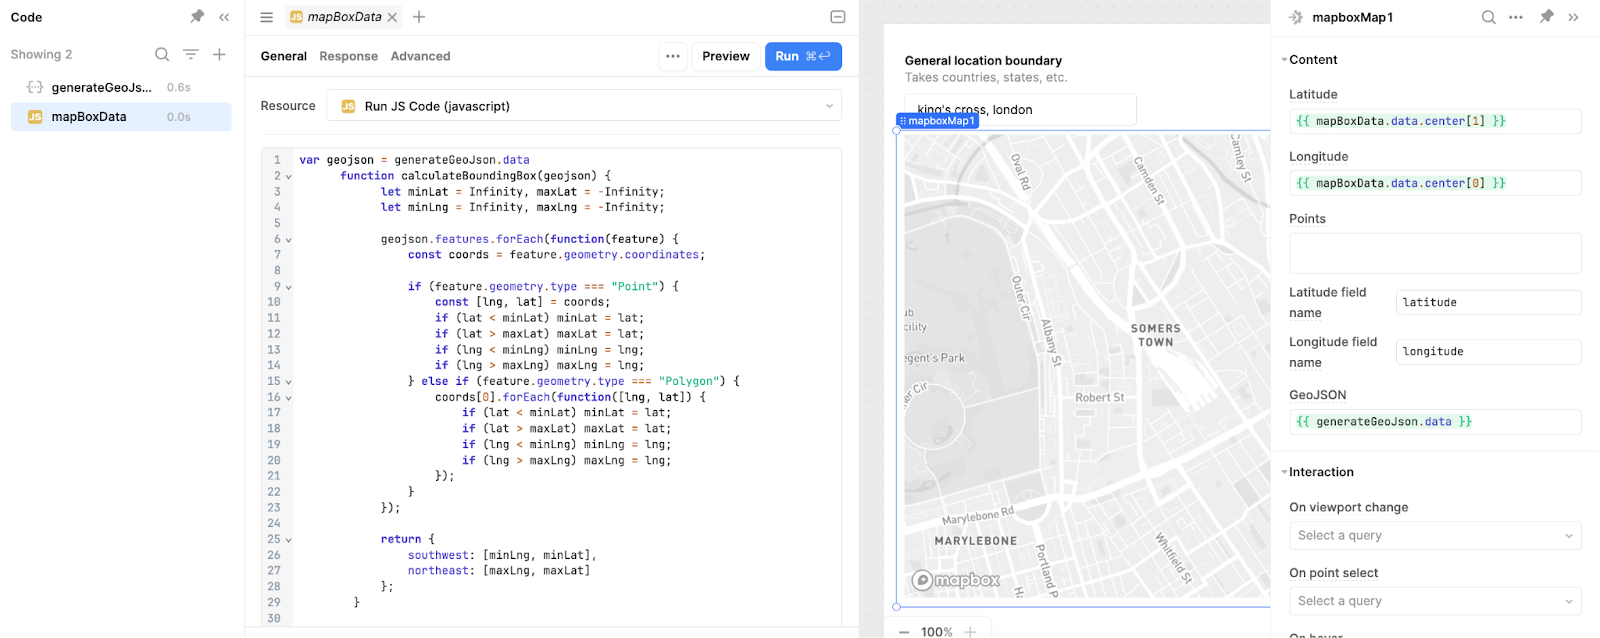
This script pulls the coordinates from the first feature in your GEOJSON response and uses them as the map’s center point.
We then referenced these as the center point in the mapbox component.
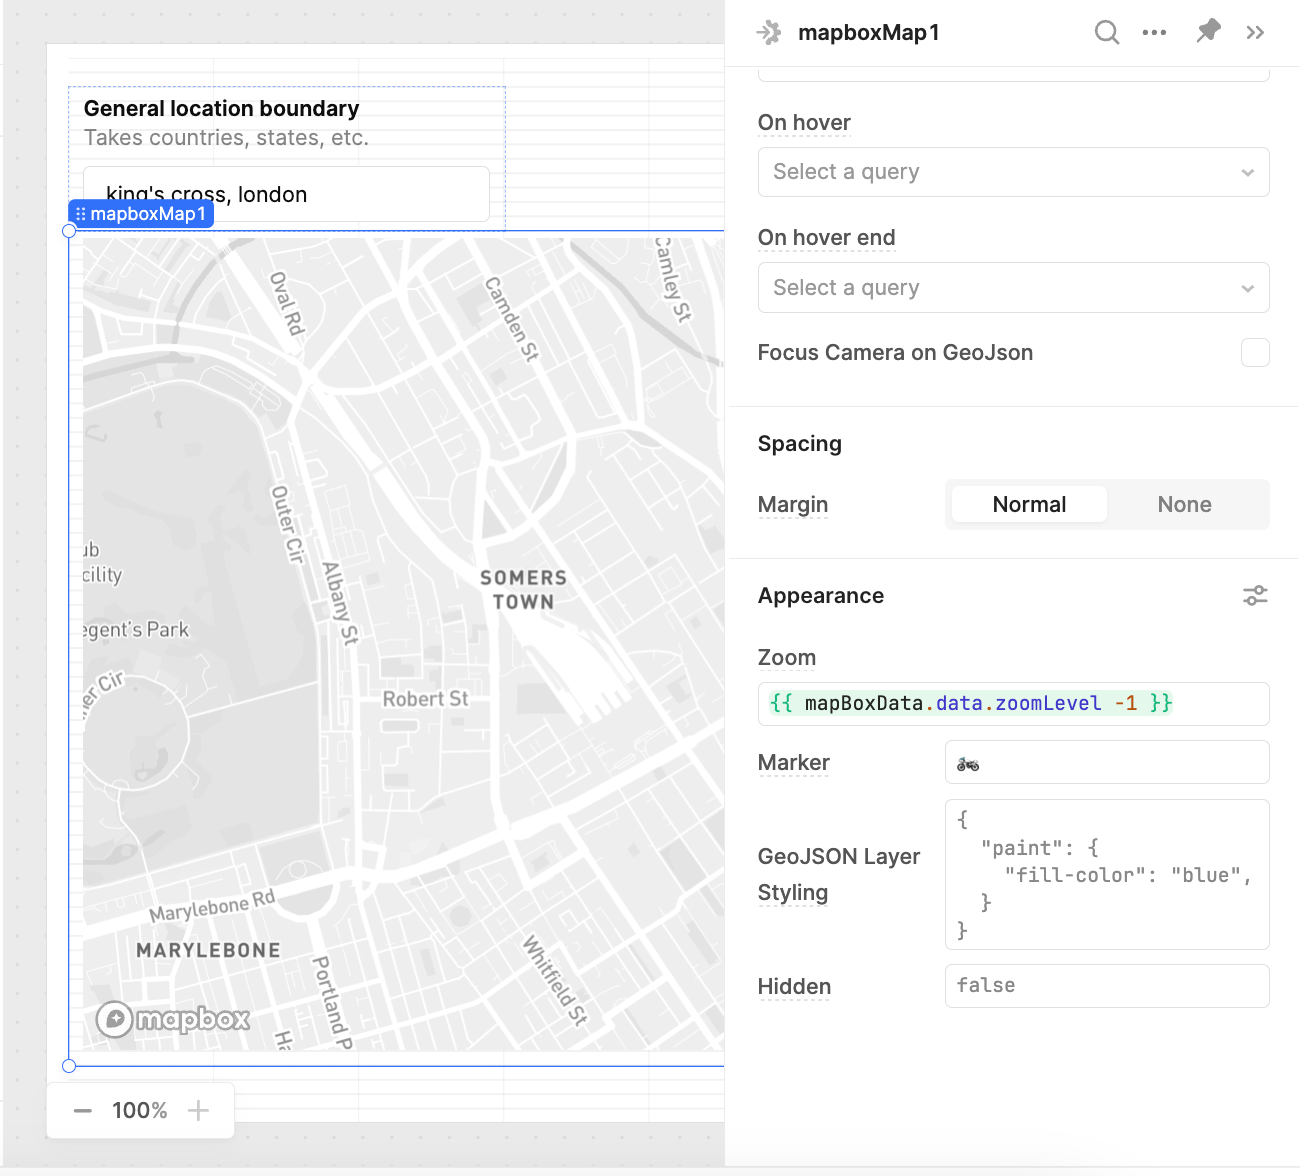
The zoom level is hardcoded to 16 in this example, but you can make it dynamic based on the size or type of the location.
To ensure the data updates when new text is searched, we set a success handler on the JS query to set the mapbox center values:
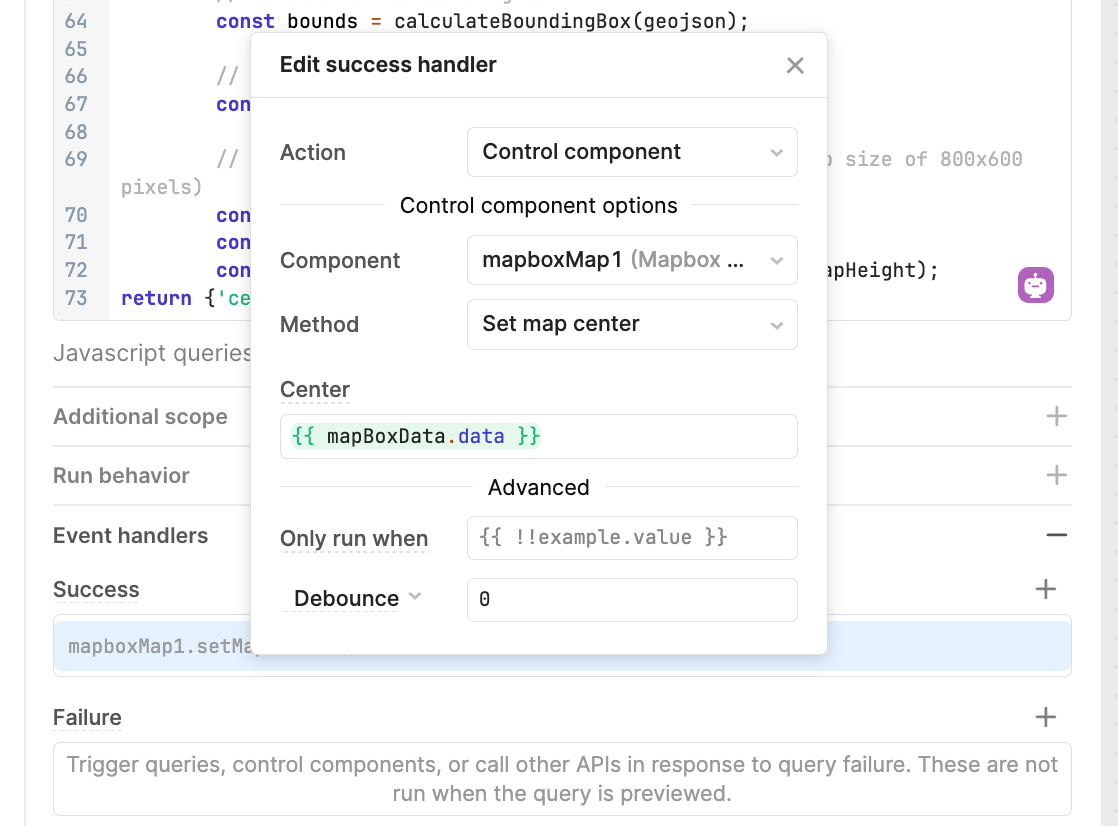
Step 3: Connecting the values to the Mapbox component
Now that we have both the GEOJSON data and the dynamic center point, it’s time to configure the map itself. Here’s what you need to do:
- Reference the Center Point – In your Mapbox component, set the center point latitude and longitude to the centerPoint values you defined in the JavaScript query.
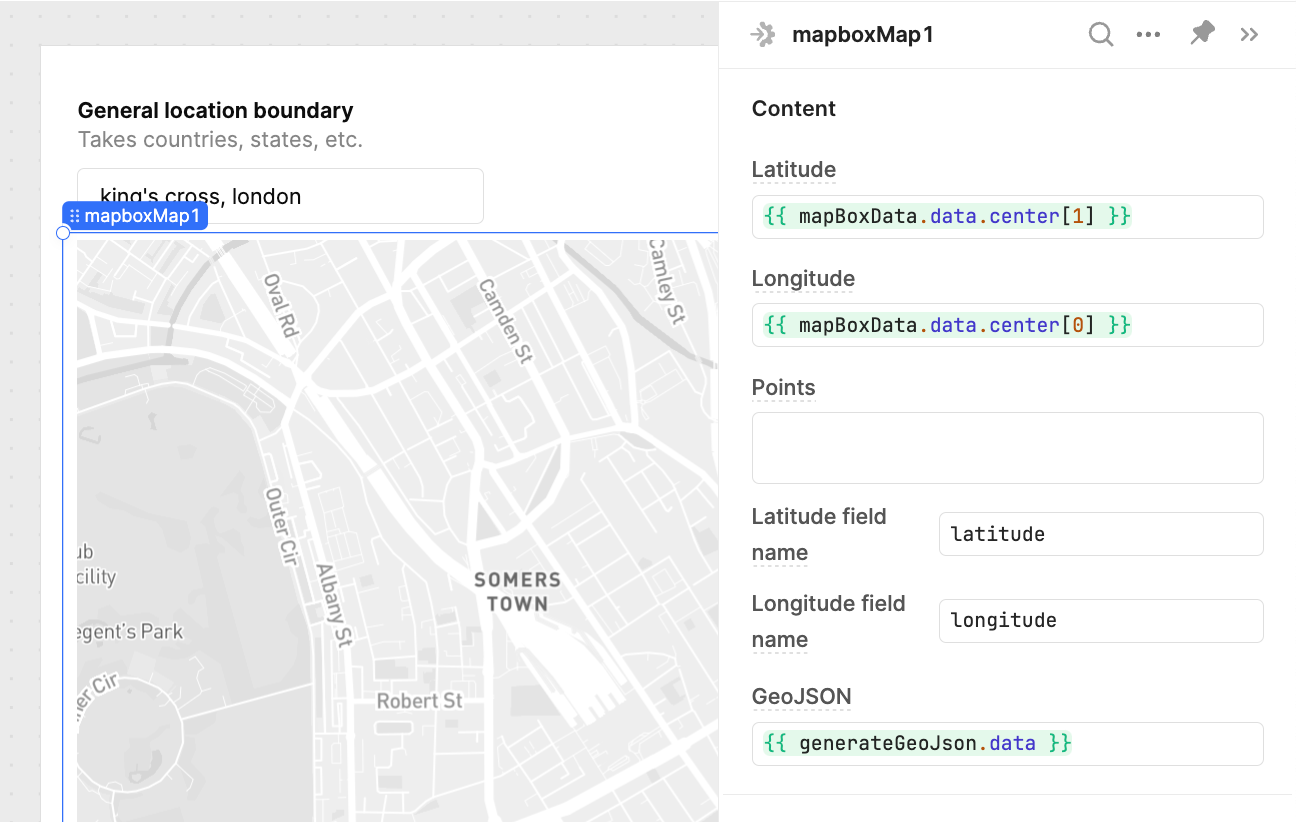
2. Load the GEOJSON – Use the GEOJSON data fetched from the OpenStreetMap API to display boundaries, markers, or other geographic features on the map.
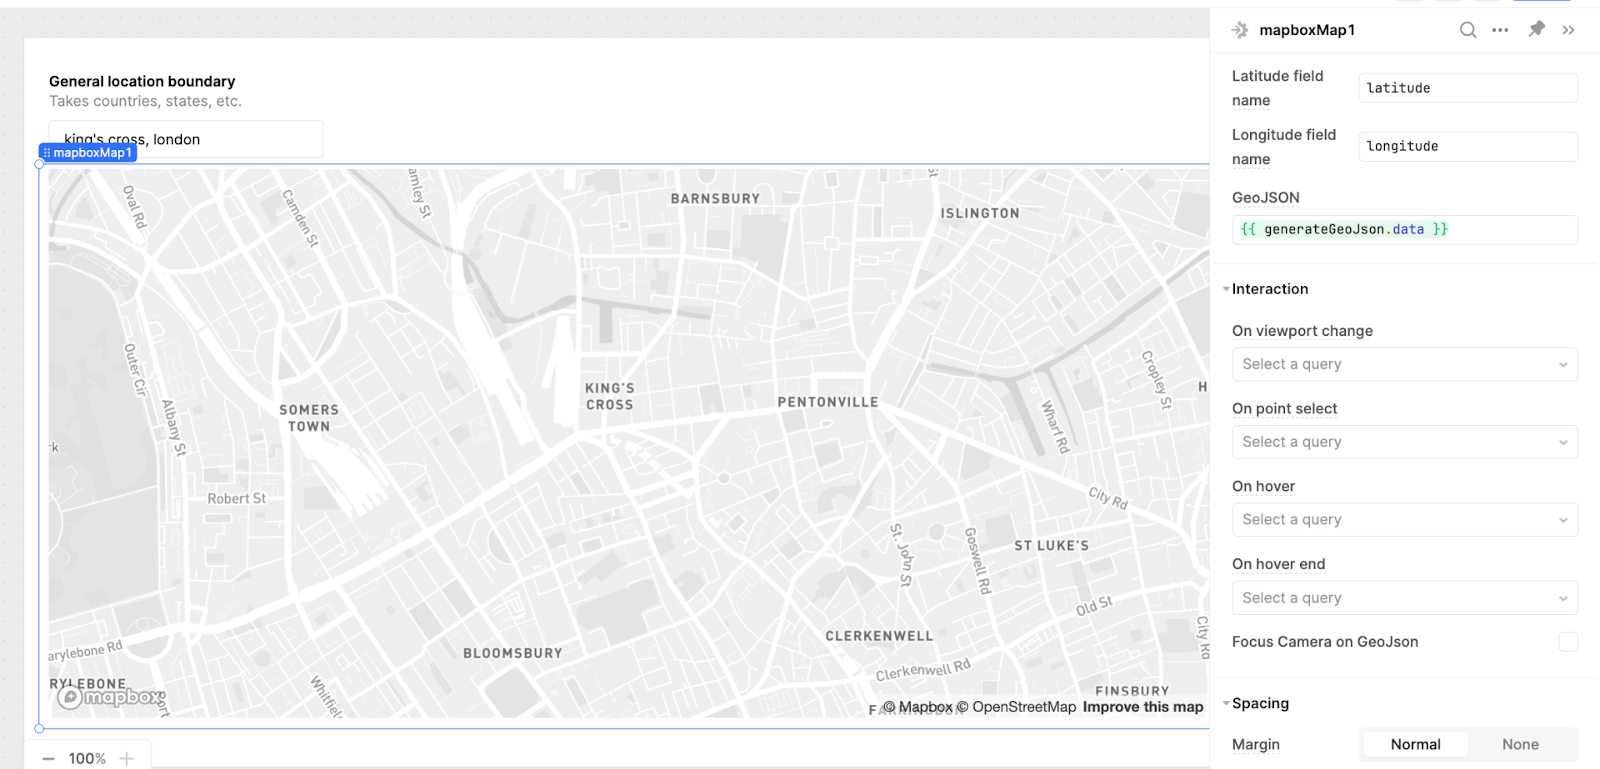
3. Set Zoom Level – Link the zoom level from your JavaScript query to your map component to ensure that the map adjusts according to the user's input.
Putting it all together
At this point, you should have:
- A text input field where users can type a location (e.g., "New York").
- A JavaScript query that pulls GEOJSON data from the OSM API based on that input.
- Dynamic center points and zoom levels that adjust the map based on user searches.
This makes your map highly interactive and customized, perfect for internal tools that need to visualize location-based data in real-time.
By following these steps, you can build a dynamic map in Retool using the OpenStreetMap API. Retool’s Mapbox component is a powerful tool that allows you to go far beyond basic mapping, making it easy to overlay GEOJSON data, set zoom levels, and center points dynamically. Try it out for your next project to see how seamlessly you can integrate maps into your internal applications.
Want to learn more about internal tools and how to build them? Check out our sections on low-code tools like Notion and Airtable, or developer tools like Retool and Windmill.

