Have a Retool app for your company with key functionality but no one can make their mind up exactly how it should look? In this tutorial, we’ll show you how to create a settings modal that will allow each user to customize their interface to suit their own preferences.
Retool’s permission functionality is commonly seen as being limited to permissions for accessing data at an app, folder or resource level. What most people don’t know, however, is that Retool can be hacked to include dynamically changing CSS, data, components, and more within the apps themselves, depending on the user (or even group) logged in. This means that developers can effectively customise user settings within Retool apps so that each user has a personalized interface.
This brings us to our tutorial: creating customized settings that are saved to a Google Sheet or separate database and applied to the app depending on the email address of the current user. In essence, this means that when a user logs in, their email address will be linked to a settings database, and this will immediately pull their saved settings and apply them to the app session.
Possible applications of custom user databases:
- Hiding certain components or containers that are not needed
- Dynamically changing table columns based on individual users’ preferences or permissions within an organization
- Allowing users to choose default ‘views’ for tabs, graphs and containers to prioritize the information they need most
- Dynamically changing button functionality based on a user’s position in the company
- Accessibility settings*
And many more!
*We will run through how to do the first three options in this tutorial - head to our ‘Accessibility Settings Tutorial’ for the last option.
Handy to know: all of these options can also be executed using the ‘groups’ function too.
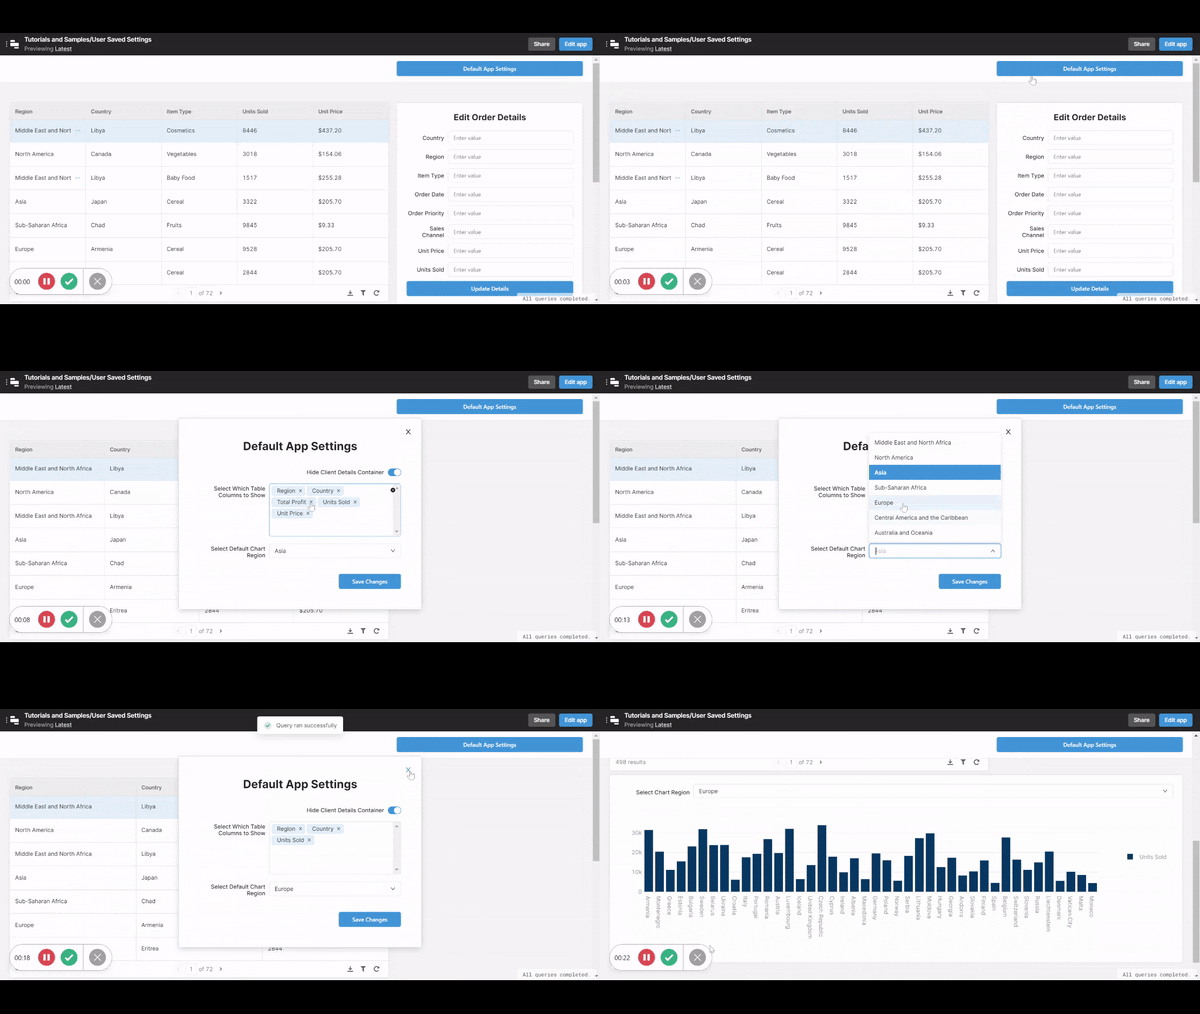
Here is an example of how your app might look by the end of this tutorial:
Creating a Settings Modal
To get started, you need to create a settings modal within your app where a user can select their preferences.
For our app, the settings modal will allow them to select which columns show in a table (multi-select component), select a default range of data to show in a graph (dropdown/select component), and hide a container that isn’t needed (switch/toggle component).
This is how ours looked:
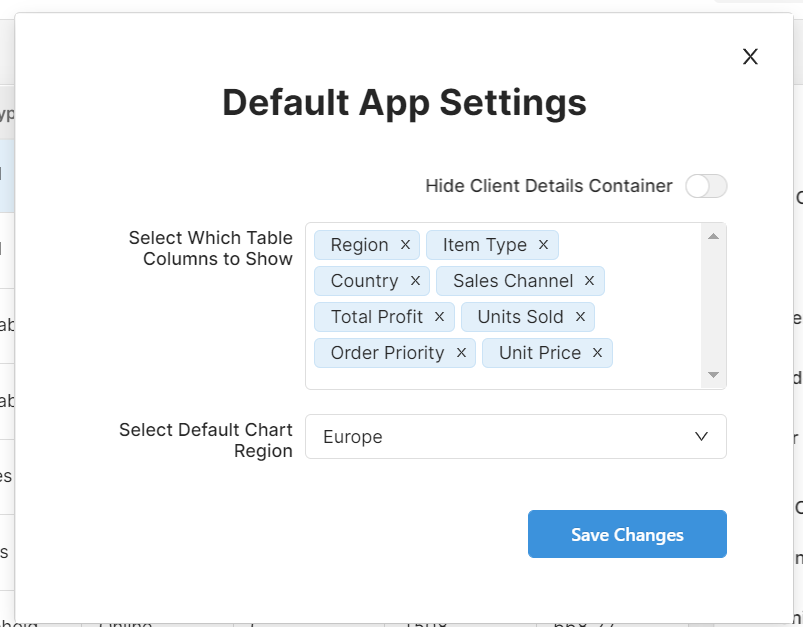
The next steps will show you how to set up the settings you see here, but if you already have the settings you need, head straight to the database section for how to connect them.
Default Show/Hide Container Setting
The first setting allows you to show or hide a container (or other component), . The show/hide toggle is the simplest setting here.
First, label your toggle however you need and add your container to your app.
All you need to do is add the following to your container component’s ‘hide when true’/’hidden’ value box, with the switch number according to your app:
{{switch1.value}}
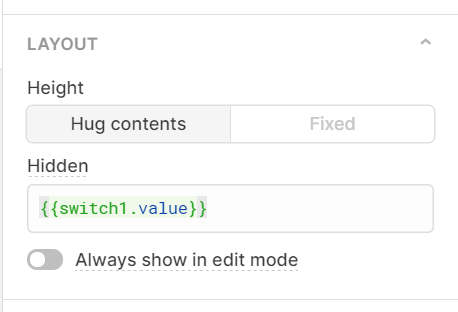
This is how this should look in practice:
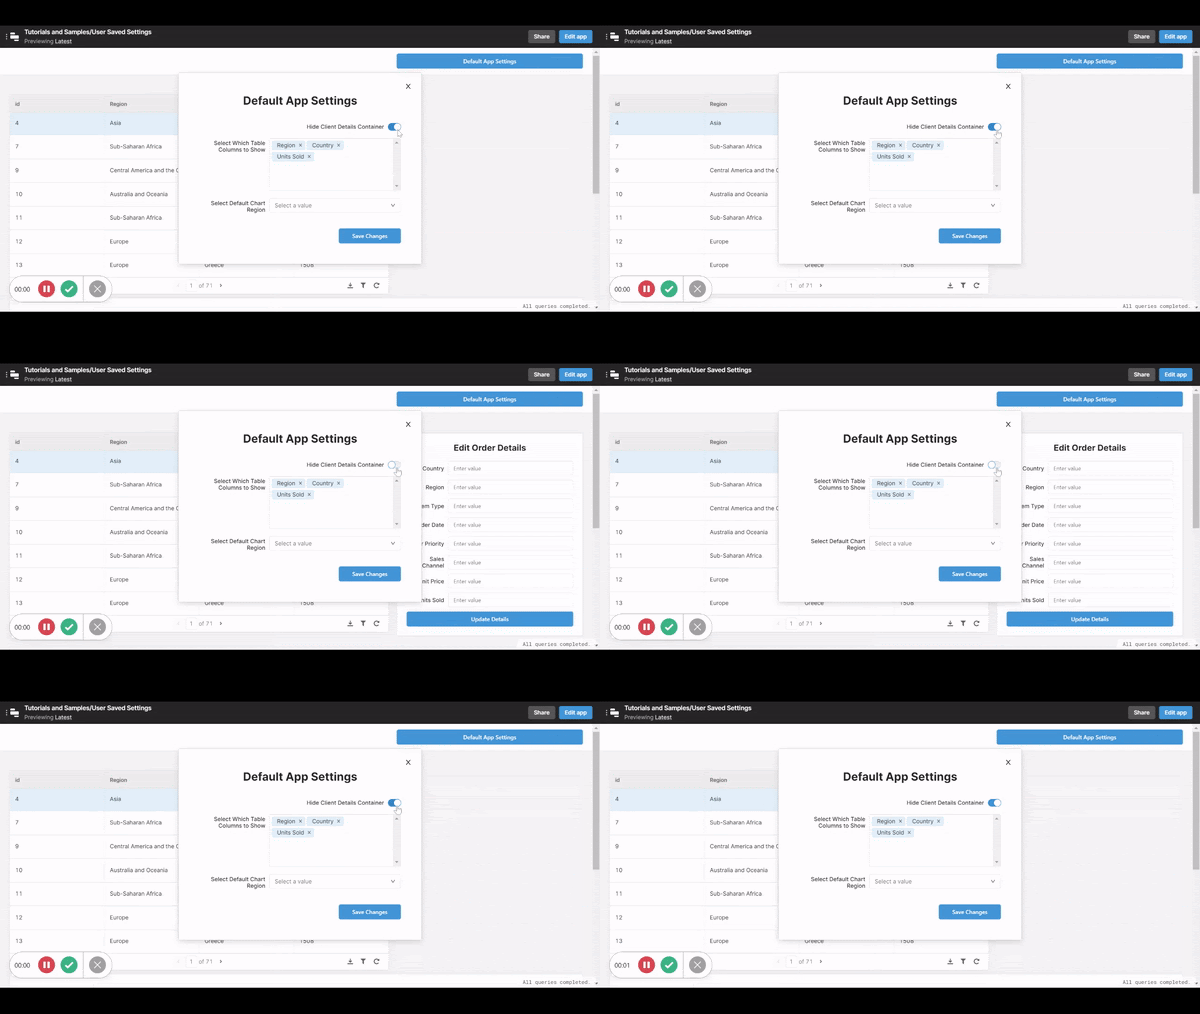
Currently, this switch only works for each session (so every time that user logs in, they will need to toggle the switch again to hide it), but we want to save the settings to automatically apply each time. For this part, we’ll need our queries ready, so if you are ready to finish off, skip to “Set Up Your User Settings Database” to continue. If you’d like to add more settings first, keep reading.
Custom Columns Displayed in a Table
If your app has a table with a bunch of columns that some users might not need, this section will help you allow them to select which ones they care about, and only display those. First, pull in a table component and connect it to a resource.
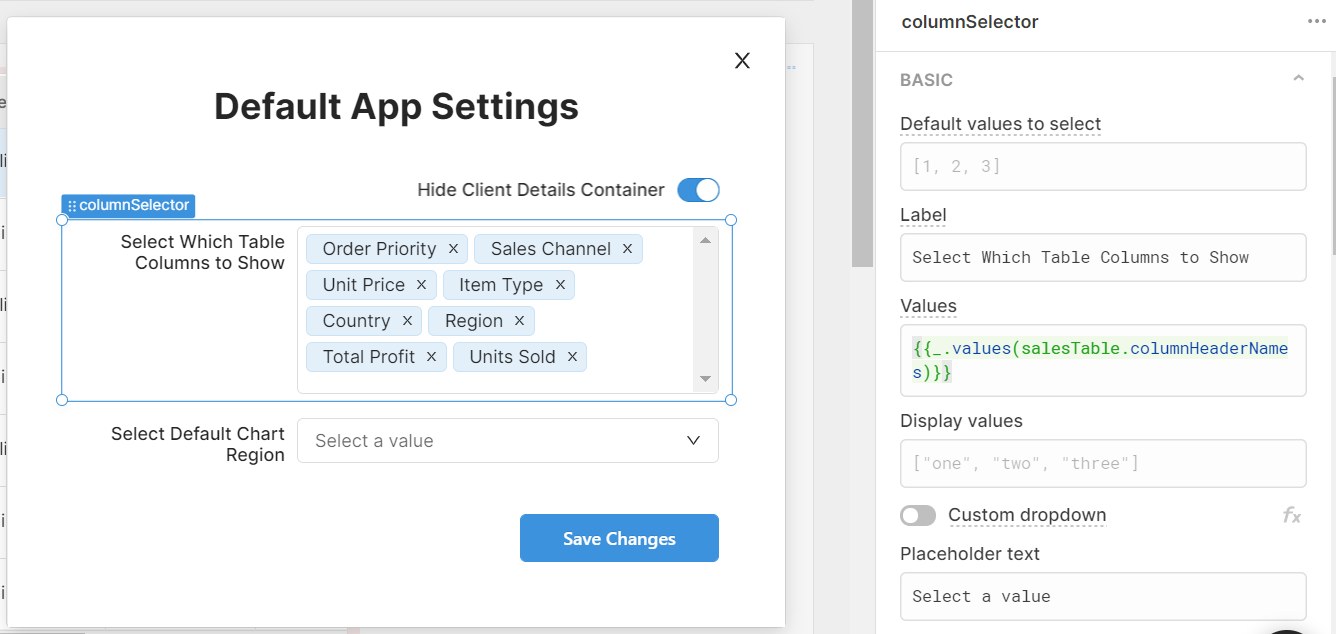
Then head to your multi-select component in your settings. In the ‘Values’ box, use:
{{_.values(salesTable.columnHeaderNames)}}
to automatically select the columns as they are named in your table)
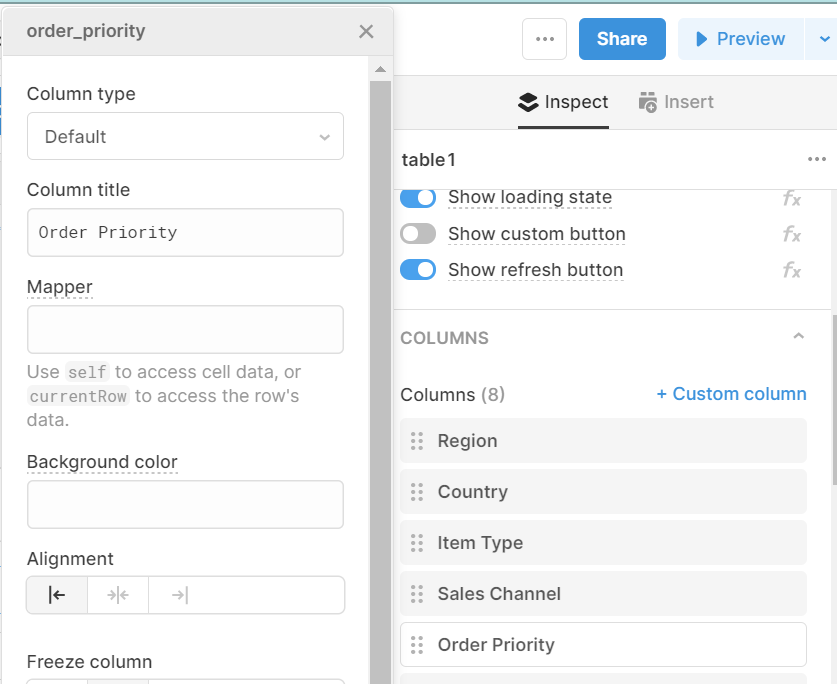
You can see and change the column titles in the table component’s column settings:
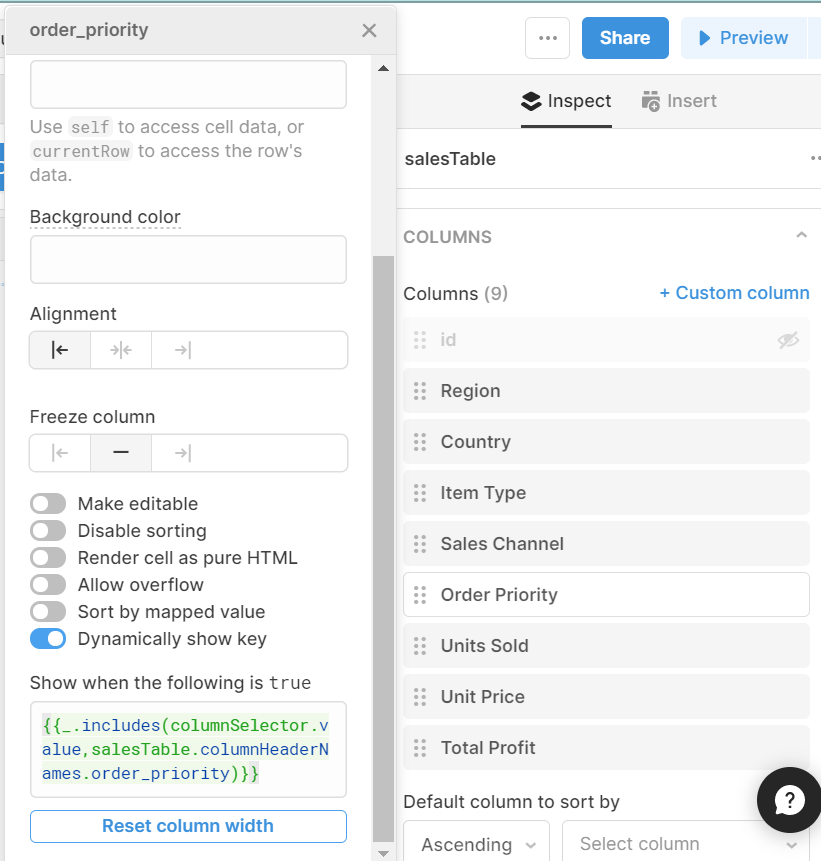
This section is where you will set your dynamic table settings. For each column you will need to toggle on the ‘Dynamically Show Key’ option and enter the code structure below in the ‘Show when the following is TRUE’ box:
{{._includes(component, “value”)}}
In our case, we want it to match the salesTable.columnHeaderName as these are the values in the multiselect, but also to match this to the current column in the table. To do this, you will use this reference:
{{_.includes(columnSelector.value,salesTable.columnHeaderNames.order_priority)}}
This is checking the multiselect (columnSelector) component for the column header name which corresponds to the ‘order_priority’ column in the backend (in this case “Order Priority”). Using the backend reference for the column here and mapping the column header name avoids the function from breaking if changes are made to column headers, as this will recognize the change automatically.
This is how it looks in the component settings:
This same process needs to be completed for each column header that you wish to dynamically show or hide, matching the backend column reference to the column selected each time.
Once all your columns are set up, your dynamic column settings are ready! This is how it should look:
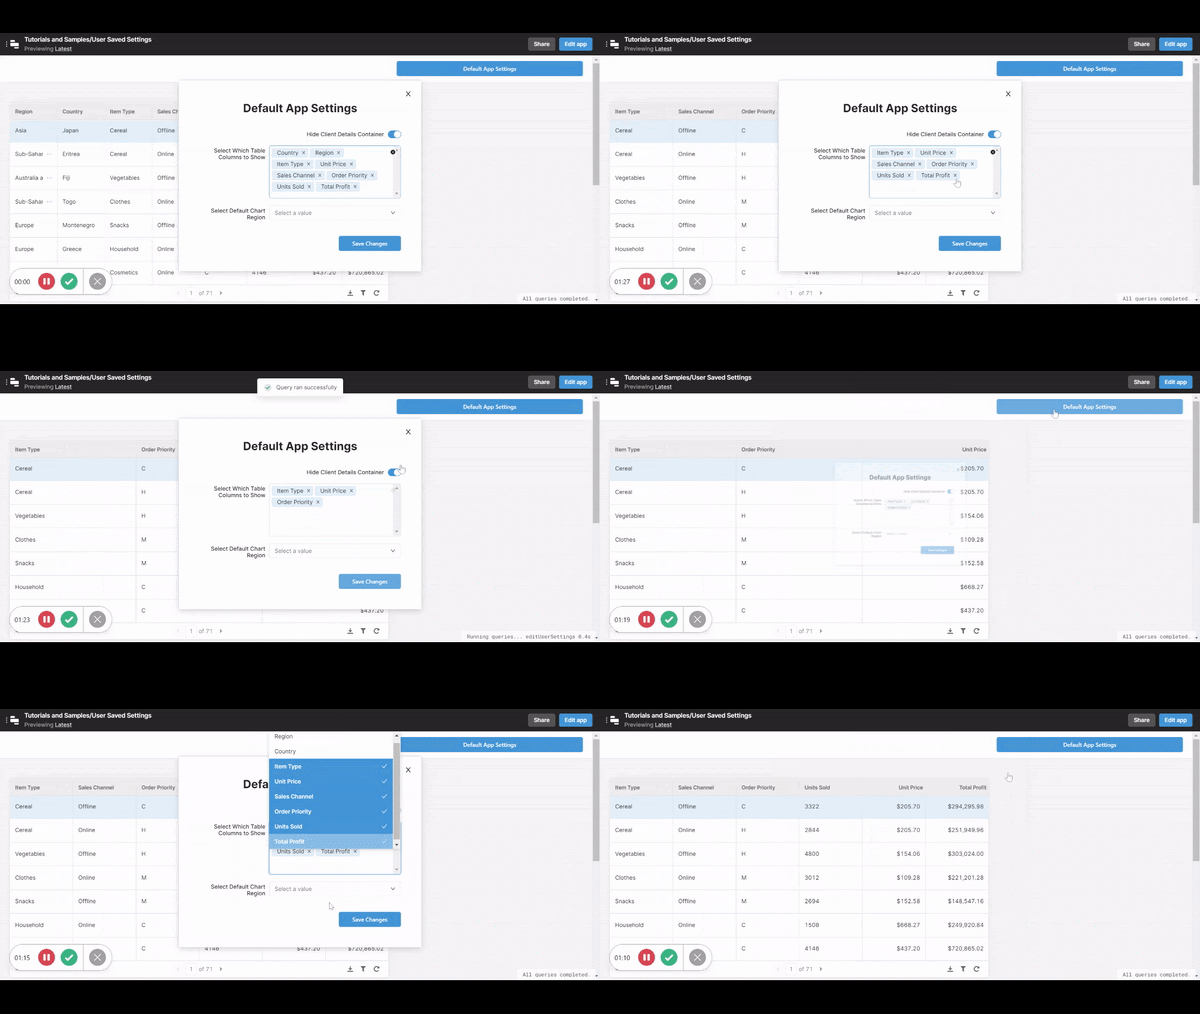
Once again, if you’d like to finish here, skip to the ‘Set up your settings database’ section, or keep reading for the final setting option.
Default Chart Data Range Setting
In our app, the chart shows sales data by country, filtered by region, with the x-axis being the country and the y-axis as the number of sales. We want our app to allow users to always see a default region when they open up the app - this might be useful for employees who need to see all available data, but their main job focuses on one area.
To do this, first pull in a chart and a dropdown component.

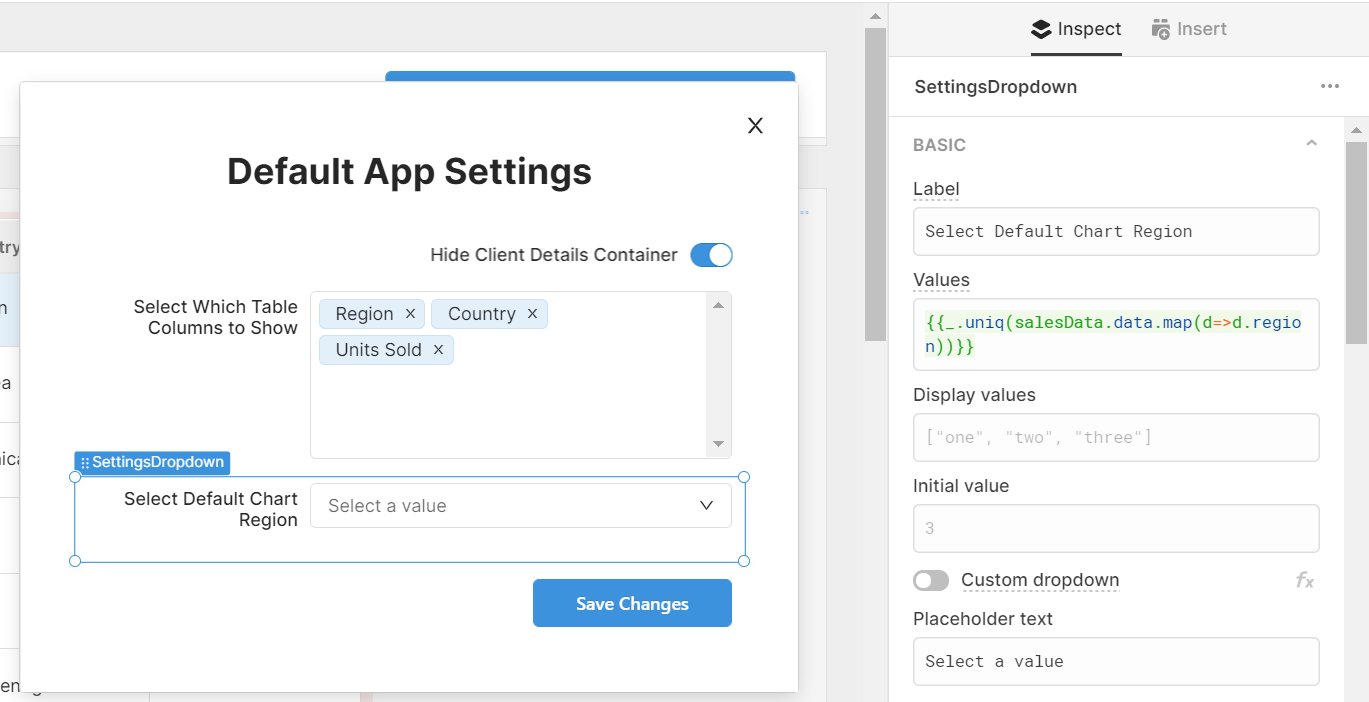
Select the dropdown component, and in the values box add in the filters you’d like to apply. In this case, we filtered the countries by region (another column in our backend data), so we used the Lodash ‘_.uniq’ function to identify the unique values and the ‘map’ function to search only in the ‘region’ column. See below for how this looks. The dropdown now allows you to select a region according to the data in the backend.
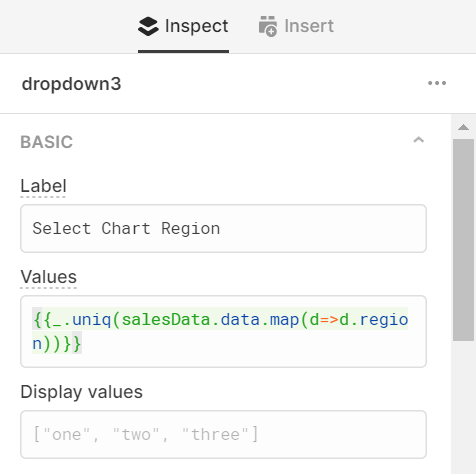
Once your in-app dropdown is ready, you’ll need a Query JSON with SQL query to filter the data in the chart by region selected by the dropdown. This is how ours looked:
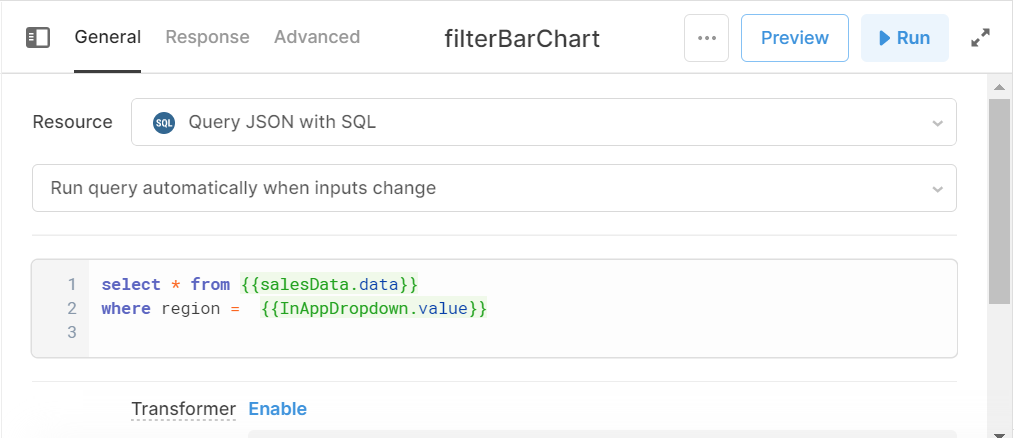
Then this “Query JSON with SQL” query will go in the data source of your chart, as well as the x-axis values. You can either select the x-axis data range options from a dropdown by clicking ‘use dropdown’, or format your data as an object for the chart as in the code below.
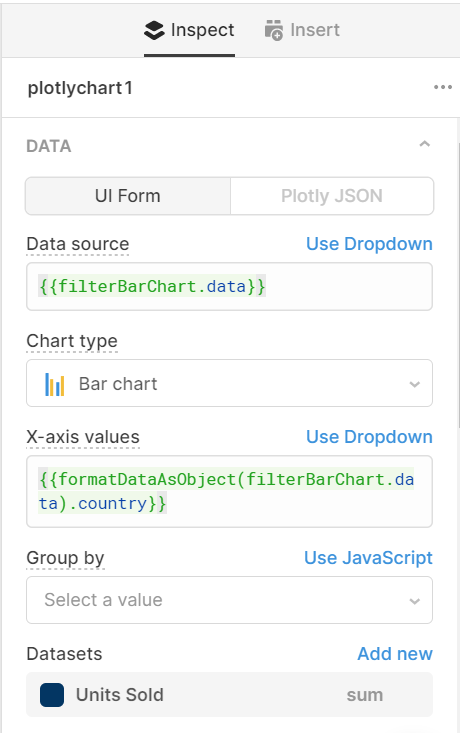
Now, your chart data is being decided by a dropdown within the app. Finally, set your default value for this dropdown to match the dropdown in your default settings modal (here: ‘SettingsDropdown’). This means that the value selected in the settings will be the default data shown when the user logs in.
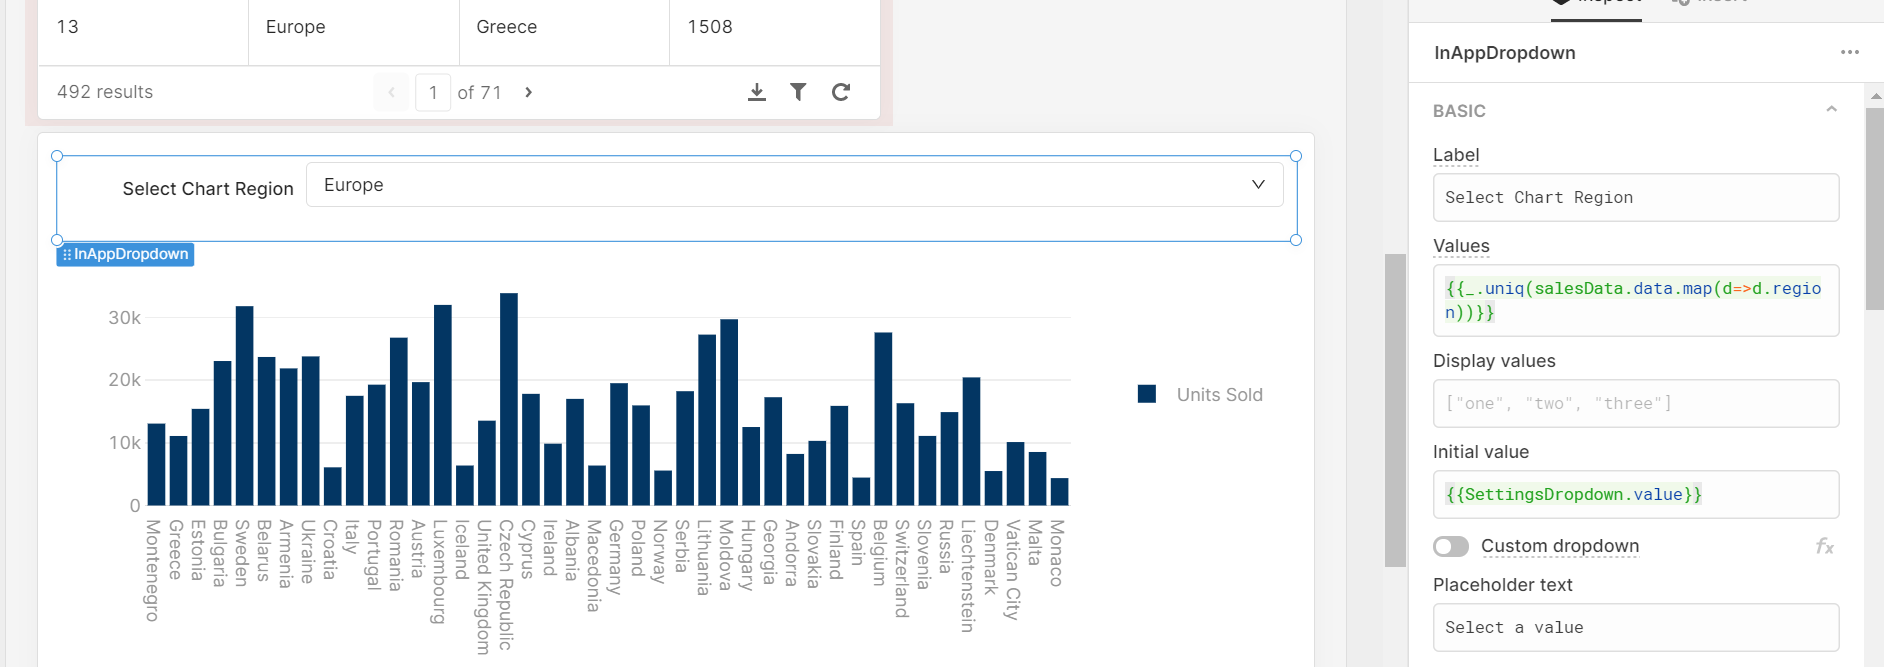
Next, head to the SettingsDropdown in your modal to set the default. Use the same Lodash function and map that we used for the first dropdown for your values:
And with that, you have the first part of your dynamic table settings finished!
Now that you have all three settings working in your modal, it’s time to set up your settings database and connect these values, so that each user has these same preferences automatically applied to each session they log in to.
Set Up Your User Settings Database
Now, a database is needed to save each custom user setting: on page load, the app will query this database, pulling in the current user's settings and applying them to the application.
So to get this section of the tutorial started, you need to rustle up a simple database on Google Sheets, MongoDB or wherever you store your data. If you do choose to use Google Sheets, be sure to not include any spaces in your column headers - that way we can reference things easily inside of Retool.
You’ll definitely need a ‘currentUser’ column for their email, but otherwise, the columns are dependent on the settings you choose to have in your app. If you have followed our tutorial exactly, you’ll also need a ‘columns’, ‘default_region’ and ‘container1’ column.
Setting up your Queries
📝Note: These are the same steps as for setting up our accessibility settings modal, so if you’ve been through this process before, you can skip quickly through - you’ll just need all the same queries, but with new columns in your settings database backend to connect to your settings modal.
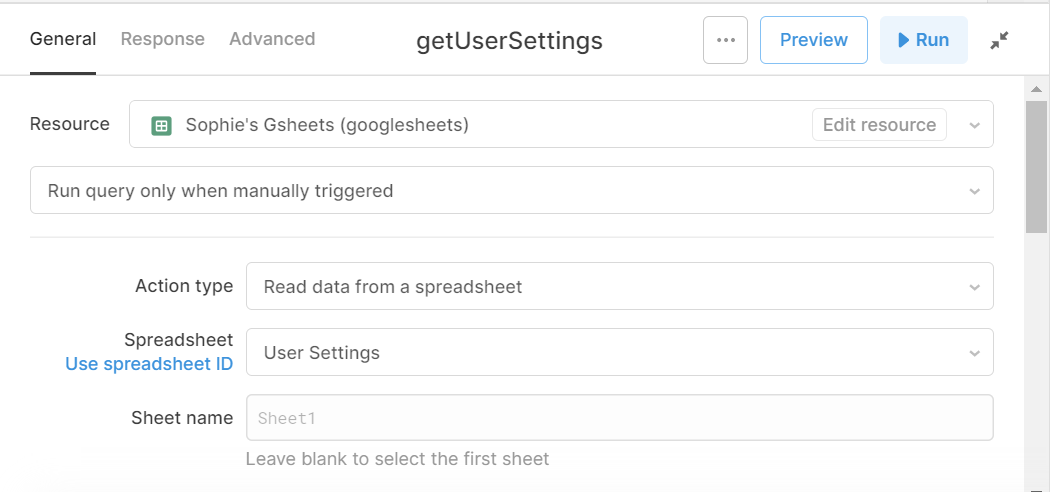
First, you need to set up a GET and POST query to save and pull each user’s settings on page load. For the GET query, we pulled in the correct sheet from our GSheets resource. Note that this exposes other users’ settings in the browser.
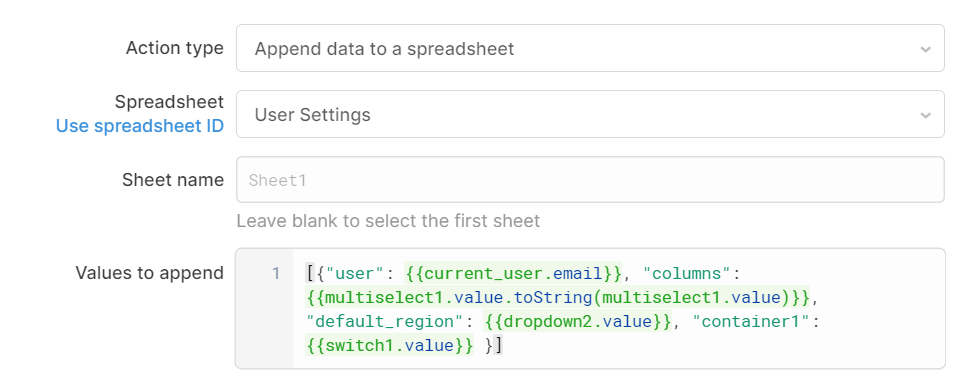
For the POST query, there’s a little more work involved. First, connect to the same spreadsheet, then select ‘append data to a spreadsheet’ as the action type, and then insert the values to append as below, according to the names of your components and the column headers in your database.
The ‘user’ value will be based on the current user’s email that they used to access Retool. To pull this data, you use a reference {{current_user.email}}.
Now we need a query to allow users to update their settings. Create a final query and set the action type to ‘Update a spreadsheet’, once again connecting to your user settings sheet or table.
.
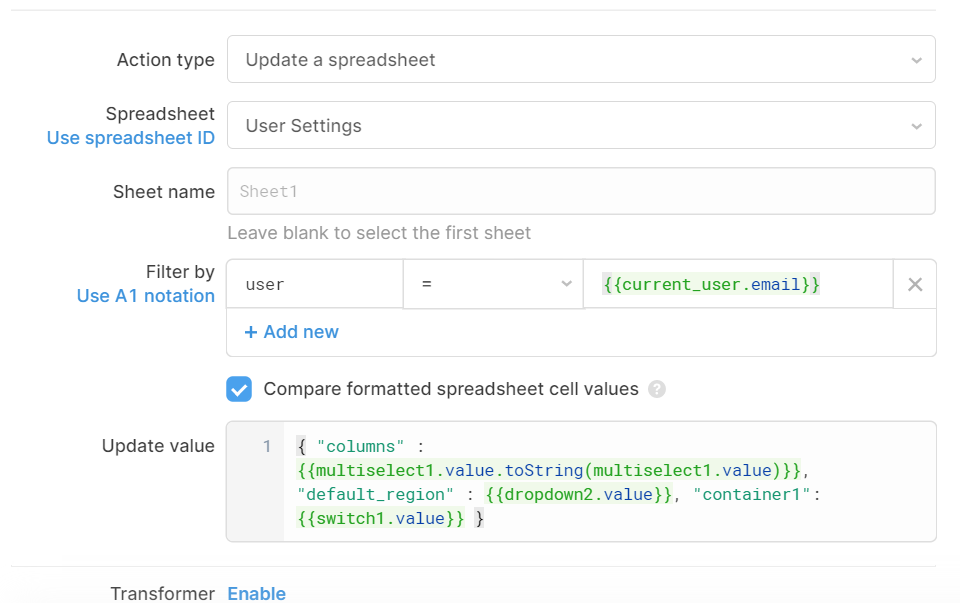
Set the ‘Filter by’ to user and the = value to the reference {{current_user.email}} to once again base these updates off the email of the user logged in.
Then set the update values just like you did in your POST query, without the ‘user’ column (as this is already filtered).
Now that your queries are set up, you need a SQL filter to pull in the correct, personalized data and apply it to your app session. This will pull in the settings data according to the email of the user. Select resource ‘Query JSON with SQL’ and use the filter below, changing the first reference to the name of your GET query and leaving the other values the same.

Once this SQL query is set up, you want to make sure that this filter is being applied every time you run your main GET, POST and Edit queries. For this, you can trigger your GET query in the ‘on Success’ event handlers of your POST and Edit queries as below:

Then, make sure your GET query also triggers your SQL filter to run again:

Now your settings backend is all set up - time to connect to your settings modal.
Connect your Settings Modal to Your Database
Within this app, the user settings work by relying on the settings modal - the modal pulls in the saved data from the settings database and applies this to the elements of the app, rather than the components being directly connected to the data in the backend. In essence, this means that the settings modal acts as a kind of ‘middleman’ between the data saved and the customizations that are applied in the app. In order for this to work, the default values of each setting component are defined by the settings saved in the backend.
Hide Container:
To connect your ‘hide container’ switch/toggle, you need the initial value to check whether the current user has any data saved in the settings, and if there is no data or the saved preference for the container is set to show, to keep the ‘hide container’ switch on ‘false’ (so that the table shows), or if the saved preference is set to ‘true’, that the container is hidden when the user logs in.
This is how this ternary will look:
{{currentUserSettings.data['0'].container1 == "" || currentUserSettings.data['0'].container1 == "FALSE" ? false : true }}
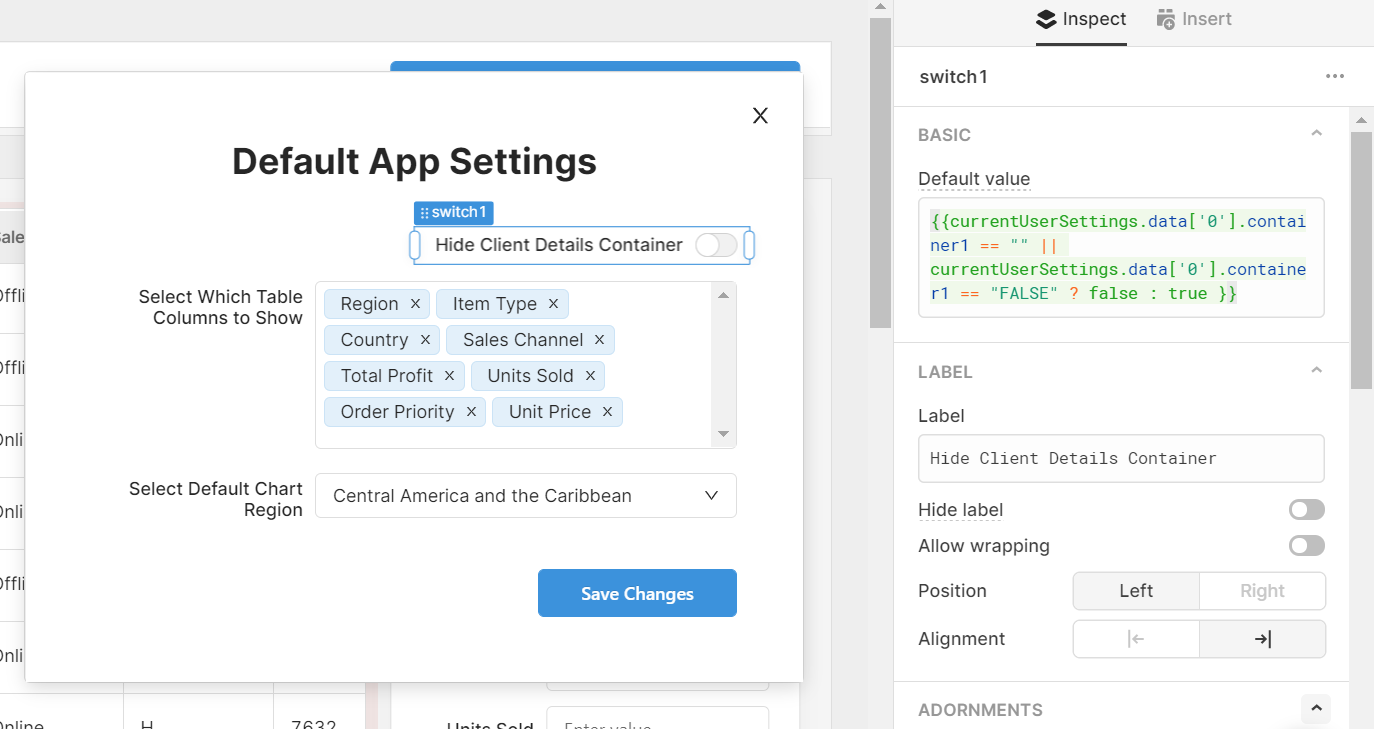
Since our data is saved in Google Sheets, which does some odd formatting with boolean values, we have had to specify the true/false values as strings - this may be different depending on the database you use.
To break down this ternary, it is referring to the settings SQL filter to pull up the first set of data ‘[‘0’]’ for the current user’s email, check if the column ‘container1’ is empty (no saved data) or set to ‘false’, and if neither of those are the case, then the switch will be on ‘true’ and the container will be hidden.
Now, when the user logs in, the settings modal will automatically keep the same settings as saved in the settings database and apply this to the container to hide or show it.
Custom Table Columns:
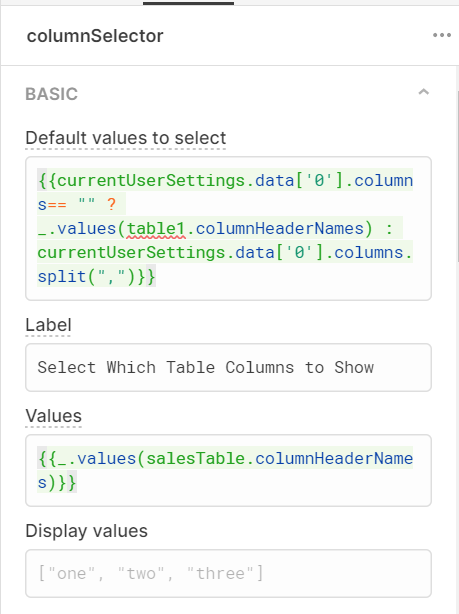
Again, we are using a ternary here to check the user settings to see if anything has been saved, and if not to automatically show all columns. If there is a preference saved, the code will split the data at each comma (which separates the data in your Google sheet) and apply the result to the selected values.
{{currentUserSettings.data['0'].columns== "" ? ['Region','Item Type','Country','Sales Channel','Total Profit','Units Sold','Order Priority','Unit Price'] : currentUserSettings.data['0'].columns.split(",")}}
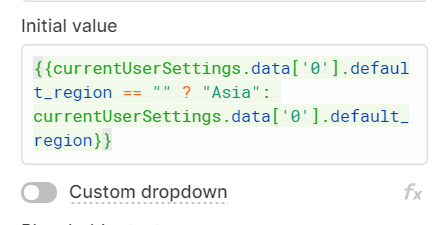
Finally, for the default chart region, our ternary checks whether any data is available and if not shows the region of ‘Asia’, and if there is a default region saved, it applies this as the default value. This then sets the value of the second dropdown within the app, so that when the user logs in, they first see the region they chose in the settings.
{{currentUserSettings.data['0'].default_region == "" ? "Asia": currentUserSettings.data['0'].default_region}}
With that - you are almost ready to go! Follow the final section to finish off your settings modal.
Set up ‘Save Changes’ button
The final step in this tutorial is to set up your ‘Save Changes’ button. If you haven’t already, add a button to your modal and label it just that.
Then, in order to differentiate between new users saving settings for the first time (your first POST query) and returning users (your update POST query), you need to set up a simple JavaScript query to check this. Create a new resource and select ‘Run JS code’. Then in the value box, add this ternary:
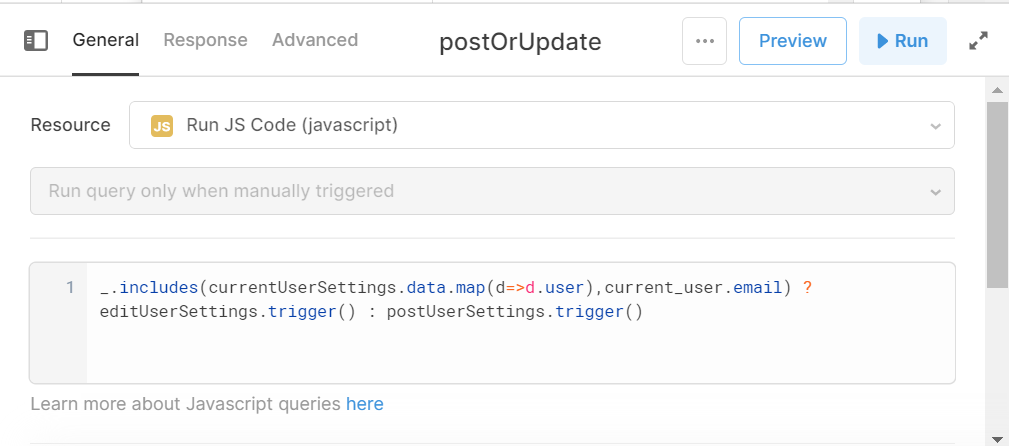
Don’t forget to replace the query names with your own.
This line of code is using your GET query to check whether the user email already exists in the user settings database, and if so, the button will trigger the ‘editUserSettings’ POST query, if not, the ‘postUserSettings’ POST query will run.
Finally, go back to your save changes button and add this query as an event handler, as below:
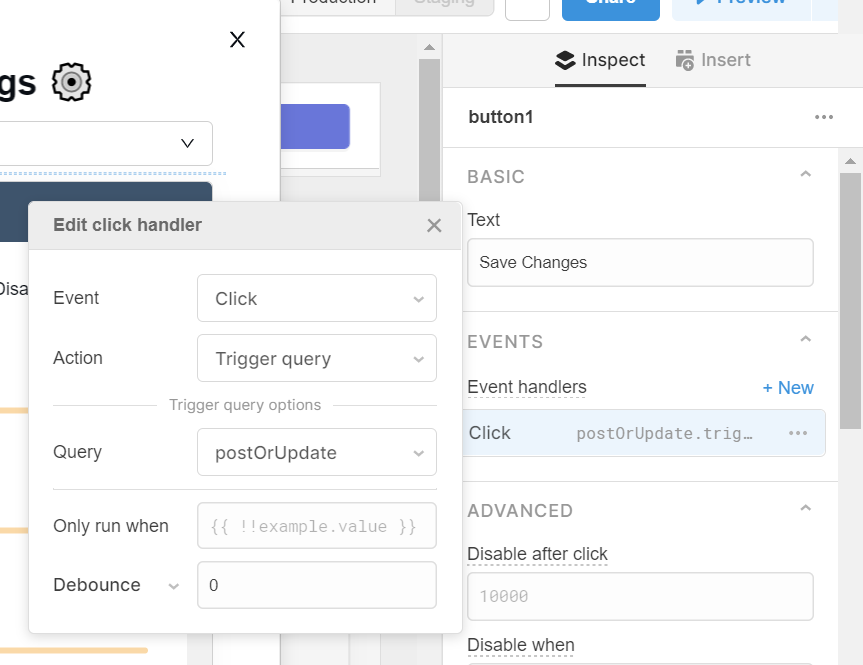
You can also add an event handler that closes the modal upon success of the postOrUpdate query, as below:

Now that your save button is set up your settings module is ready to go!
The usefulness of this Retool hack doesn’t end at individual user customization, but can also apply to the use of groups, part of Retool’s ‘User Permissions’ functionality, tutorial coming soon! You can also check out our Accessibility tutorial for how to use these settings to create custom CSS accessibility features for your users!


