


Google Sheets is a practical and affordable resource for storing data in a way that users can easily understand. However, spreadsheets can only go so far in keeping data safe and building interactive interfaces, especially when these datasets grow significantly.
Using a combination of Retool and Google Sheets, we can quickly build prototypes, MVPs (Minimum Viable Products), and Proofs of Concept in a fraction of the time. In this tutorial we are going to create a Google Sheets order management CRUD (Create, Read, Update, Delete) application using Retool.
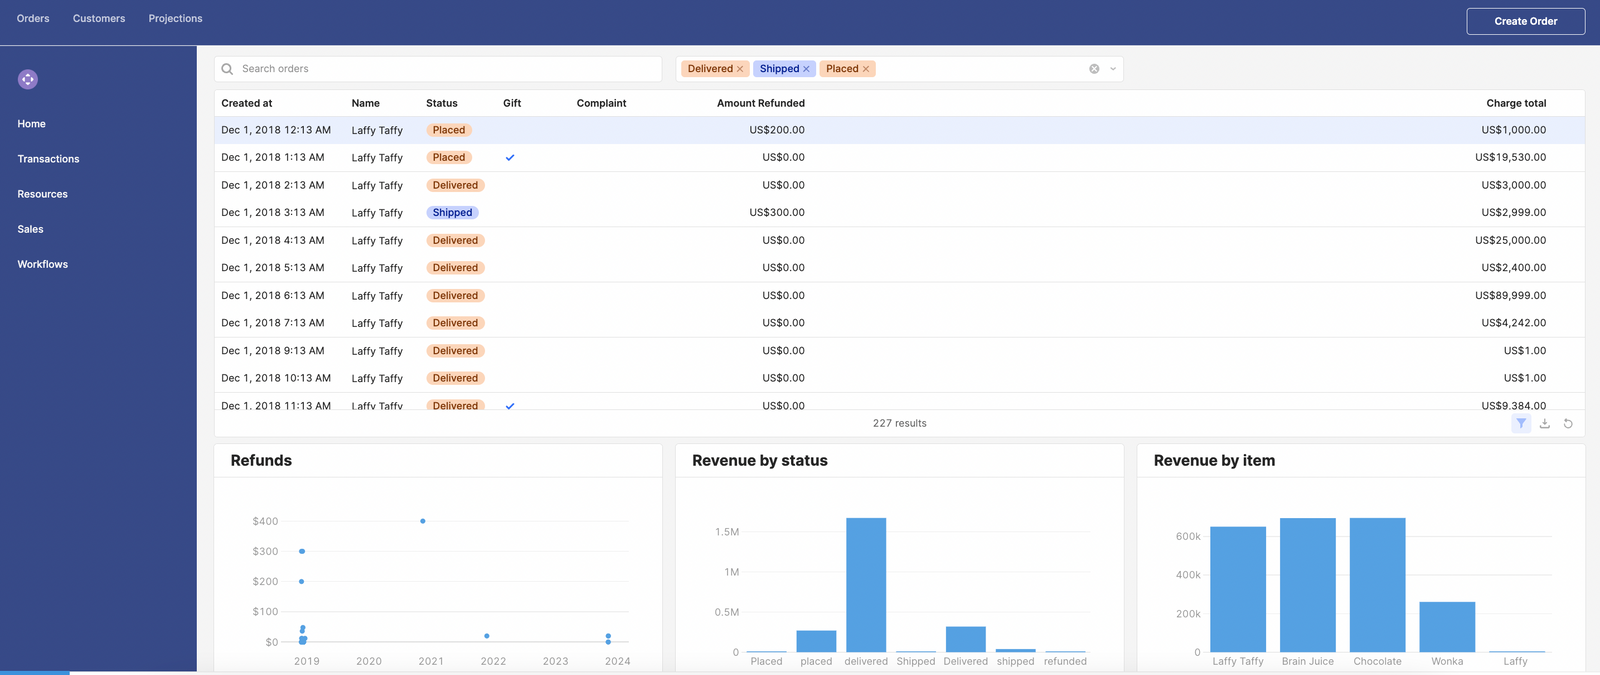
This is what our final dashboard looks like:
Why should you use Retool to build your Google sheets applications?
For those that don\'t already know, Retool is a developer platform that allows users to build internal applications and business software much faster than building with traditional code. You can learn more about it in our What is Retool guide.
Using Retool for your Google Sheets data in a simple CRUD app offers better security, scalability, and customization options compared to relying solely on Google Sheets. It makes working with your data more efficient and collaborative, providing a smoother transition from traditional spreadsheets to a more versatile application environment.
- A large library of drag-and-drop components and custom UI build
Retool allows you to create highly customized user interfaces tailored to your specific needs. While Google Sheets offers basic customization, Retool provides a more flexible and dynamic environment for crafting user experiences.
- A granular permissioning set
Retool provides robust security features, including user authentication and authorization, to control access to your CRUD applications. Google Sheets may not offer the same level of granular control over user permissions and data security.
- Easy integration with additional resources
Retool allows easy integration with various databases, enabling you to connect directly to your data sources, ensuring real-time updates and data consistency. Google Sheets, while powerful, lacks the same level of database connectivity.
- Better data handling
Retool offers a more sophisticated environment for complex data manipulations and transformations. It provides a visual interface for building queries and transformations, making it easier to handle advanced CRUD operations compared to the formula-based approach in Google Sheets.
- Ability to build out a wider infrastructure when needed
As your application grows, Retool provides a scalable solution that can handle increased data volumes and user interactions. Google Sheets may face limitations in terms of scalability and performance for larger datasets and user bases.
Now we have you convinced, let’s jump into a quick tutorial in which we will build a simple CRUD app on top of an existing Google Sheet, with some great additional features that Retool offers, all in less than an hour!
Tutorial: Build a CRUD app in Retool on top of your Google Sheets data
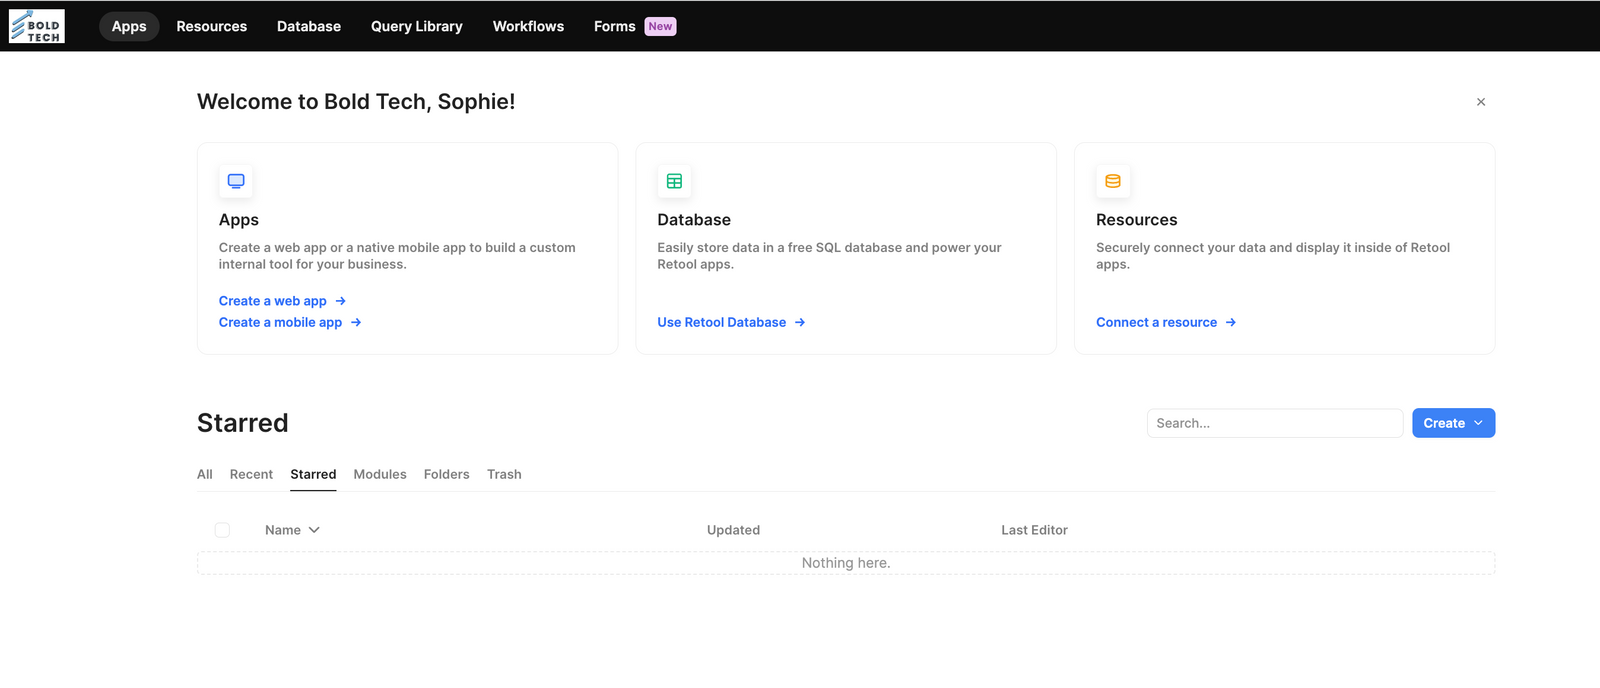
To begin, you\'ll need to set up an account in Retool.
On the first screen, you\'ll see some of the options Retool offers, such as app building, resources, database, workflows and more.
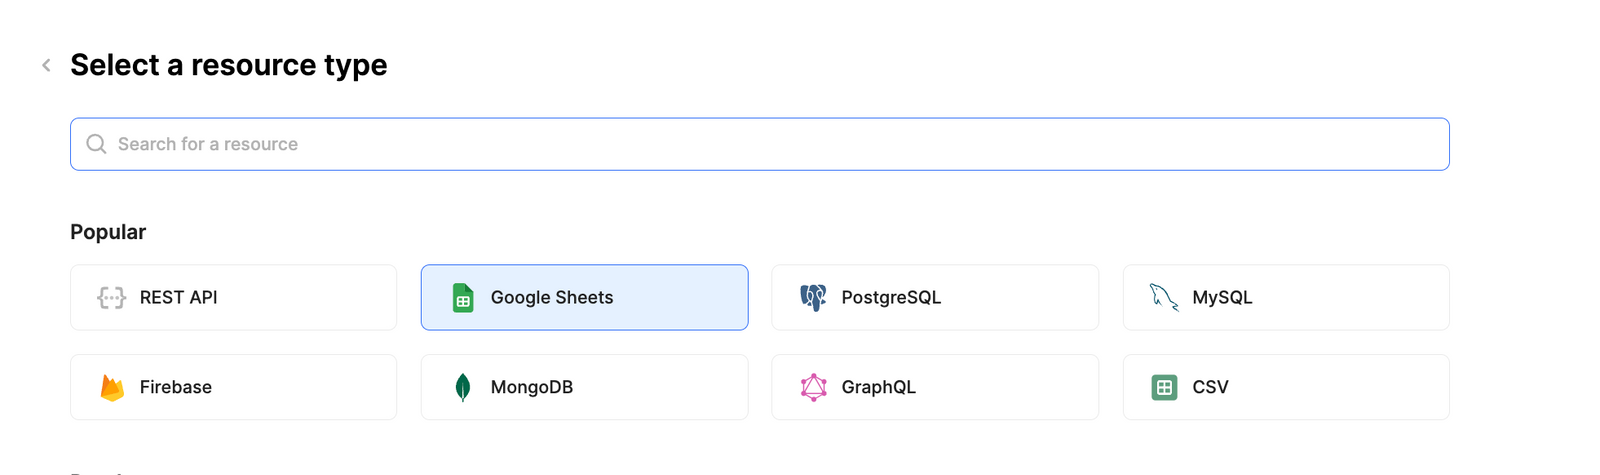
Connect Retool to Google Sheets
Getting started with your Google Sheets connection is really easy. All you need to do is head to the resources section in Retool, add a new resource, select Google Sheets and connect to your Google account with one-click authentication.
Next, open up a blank new Retool app from the apps page to get started building your UI.
When you open a Retool app, you’ll see a blank canvas and a panel on the left-hand side. On that panel, you have:
- ‘Add’ option to pull in your drag-and-drop components
- The component tree, which shows the app elements
- The code section, where you’ll set up resource queries and scripts
- A code search function
- The ‘State’ tab, which helps developers look deeper into the app’s code and variables
- The release/history tab to investigate past actions and processes, as well as version control
- Settings to control overarching app features
The bottom bar also shows you release information, and has the button for the debugger to help you fix any problems. In the top right corner, you can preview and share your app. Once you drag a component onto the canvas, you can manipulate its properties and functionality using the ‘Inspector’ tab.
Now let\'s pull in some data.
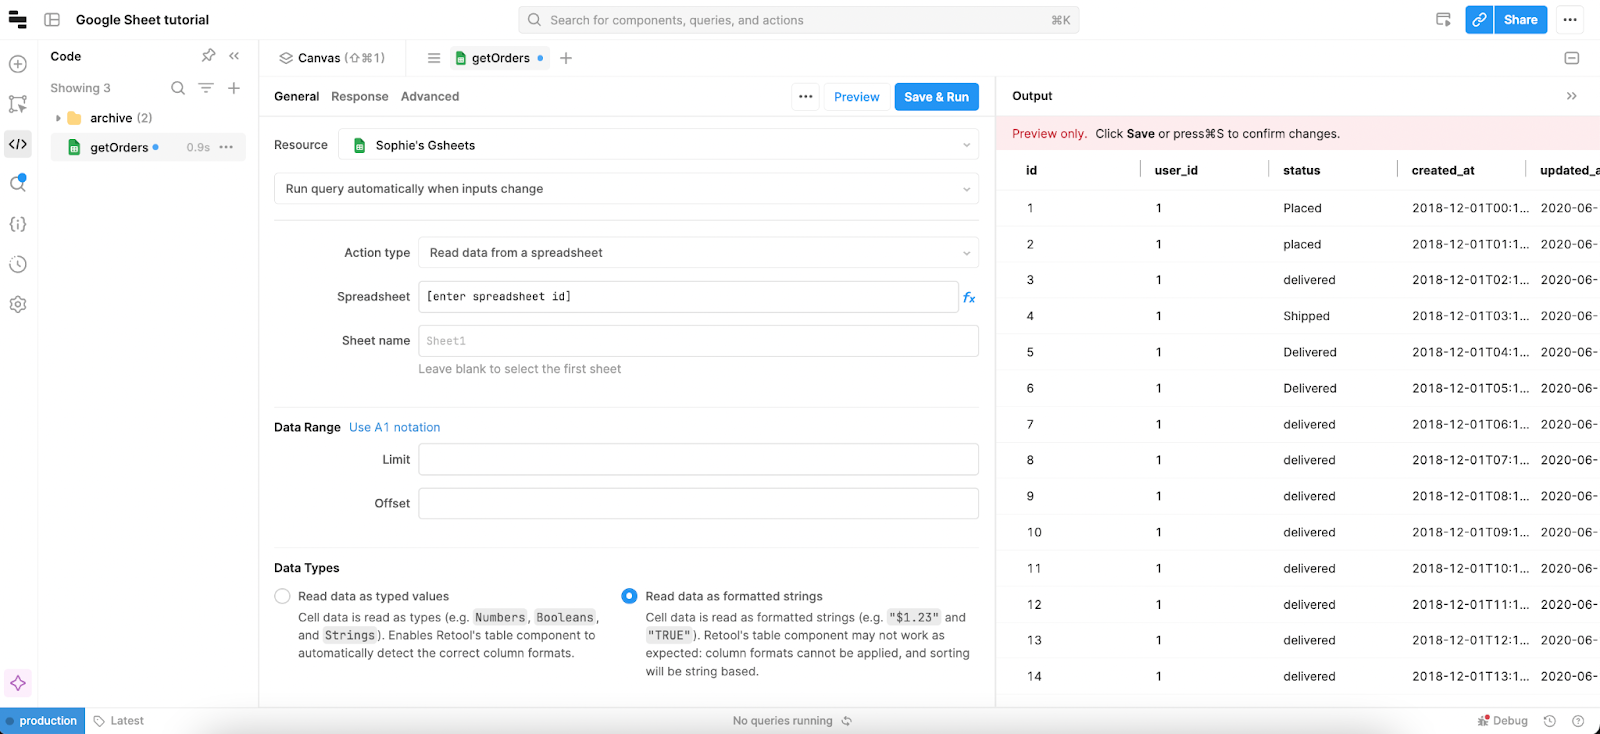
Step 1: Set up your ‘Get’ query
First things first, you need to pull in your data from your Google Sheets account. For this, you’ll need to open up the Code section on the left-hand panel and add a new query with the + button. In this query, you’ll select your Google sheets resource, and then set the Action type to ‘Read data from a spreadsheet’. You can then select the spreadsheet from the dropdown or enter the spreadsheet ID under fx (which is in the Google sheets URL of the respective sheet you are using).
Press Save & Run, and your data should return a little like this:
So far so good! Now we have some data, let’s set up the first stages of the user interface.
Step 2. Set up your canvas & table component
Let\'s say we are a company that delivers candy in bulk to retailers. We have an order tracker in Google Sheets that does the job, but it\'s just too easy for someone to accidentally change a value, and the data inputs are not validated. We already have some apps in Retool for our Sales and Customer data, so now we\'re going to pull in our order tracking app to our existing internal tool infrastructure.
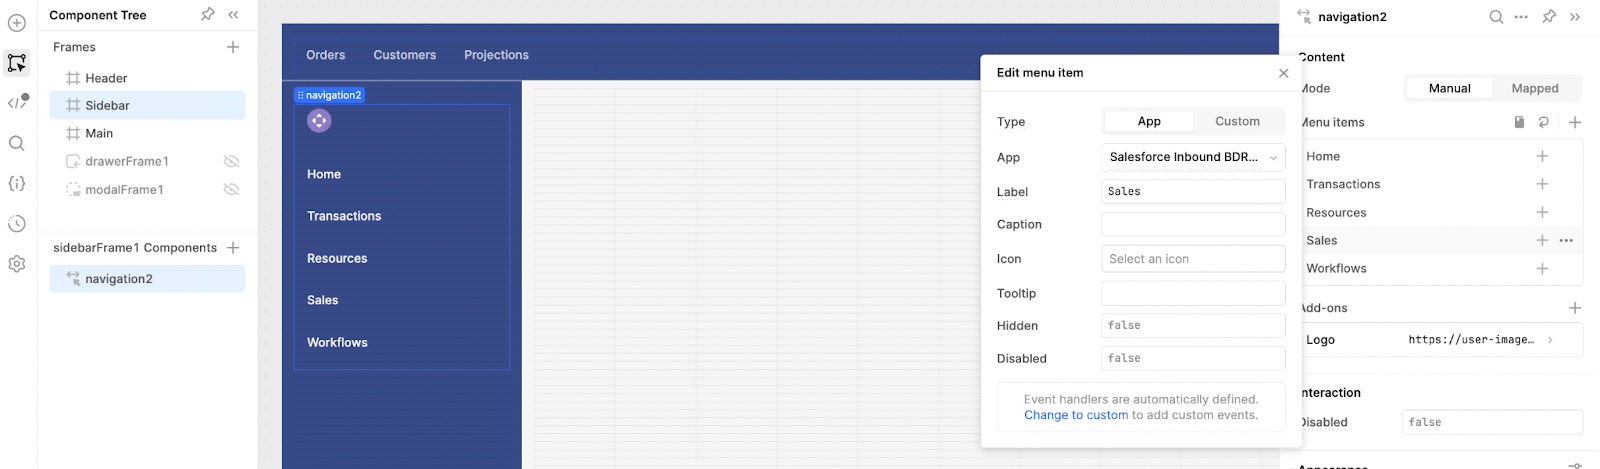
For this example app, we have started the canvas with a header and sidebar frame that helps us to navigate to other apps in our internal system, which you can configure under the Component Tree. To do this, you can pull in a ‘Nav’ component from the ‘Add’ section on the left panel and configure the links to your other apps.
Next, you’re going to present your Google Sheets query data in a table component. Under the ‘Add’ option on the left-hand panel you just need to select a table component and pull it onto the canvas.
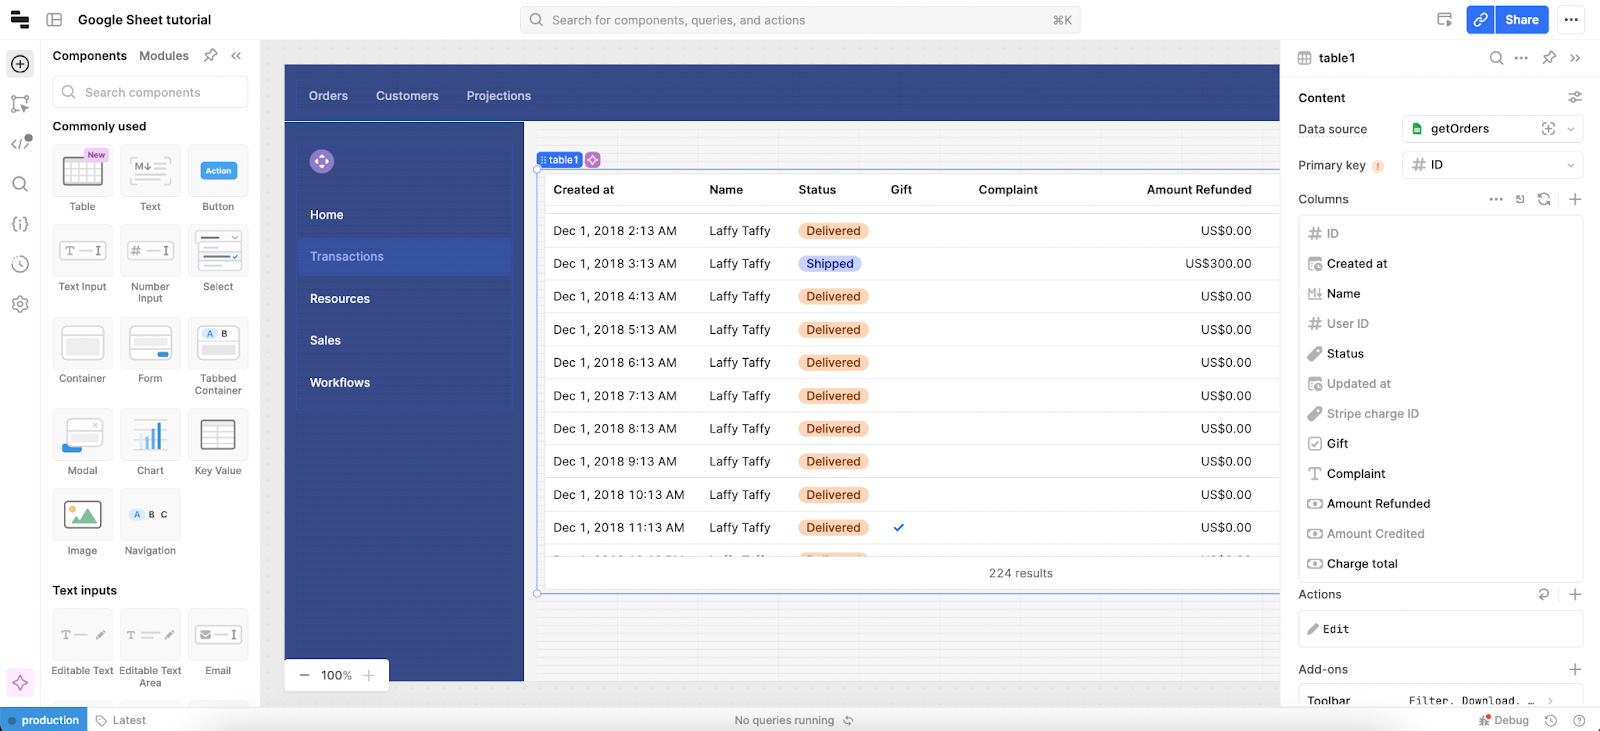
Once you’ve pulled in your table, open the Inspector panel to set it up. The table data source should default to your first query, but if it doesn’t you can select your getOrder query from the dropdown.
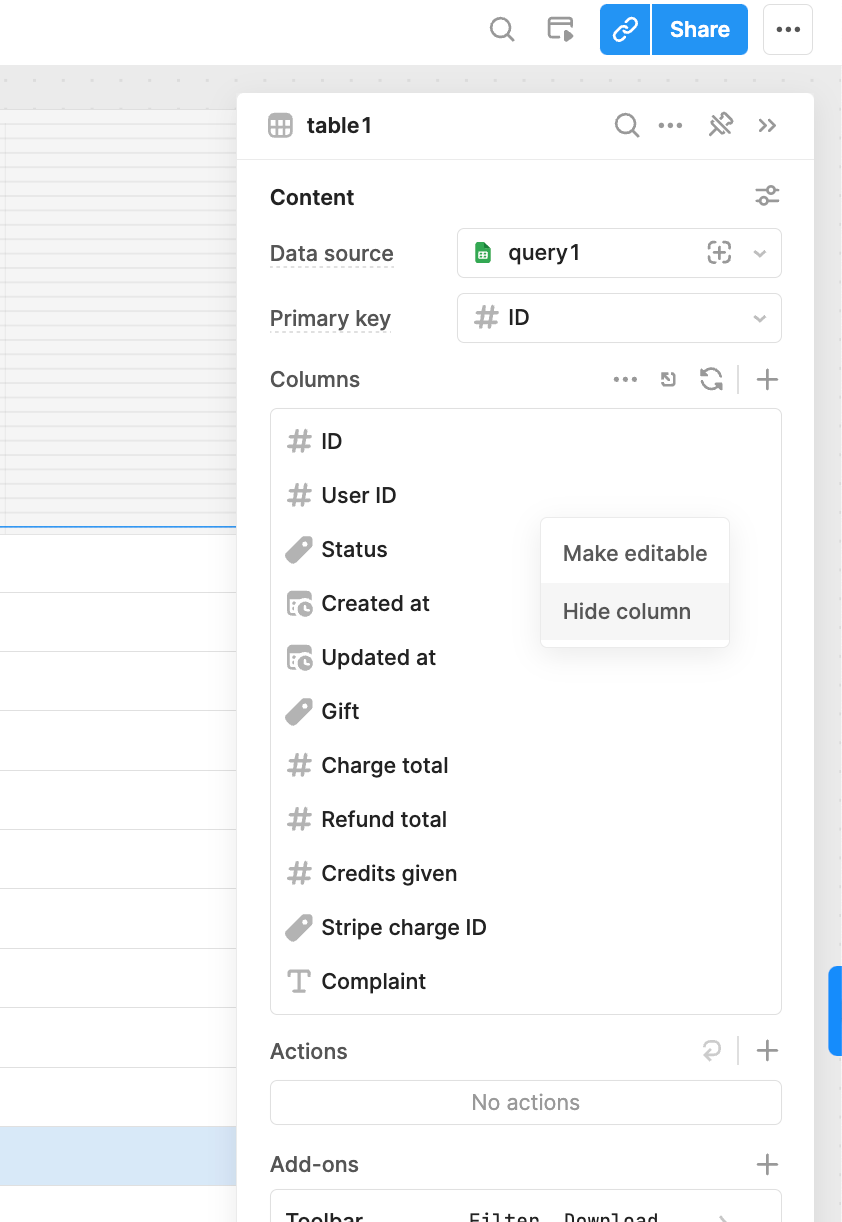
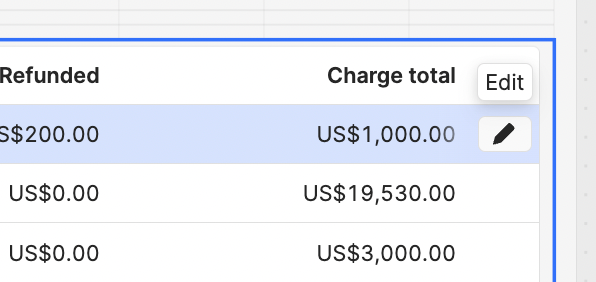
Here you can also set a primary ID, and configure your columns. First, you can set which columns are hidden or shown, as below.
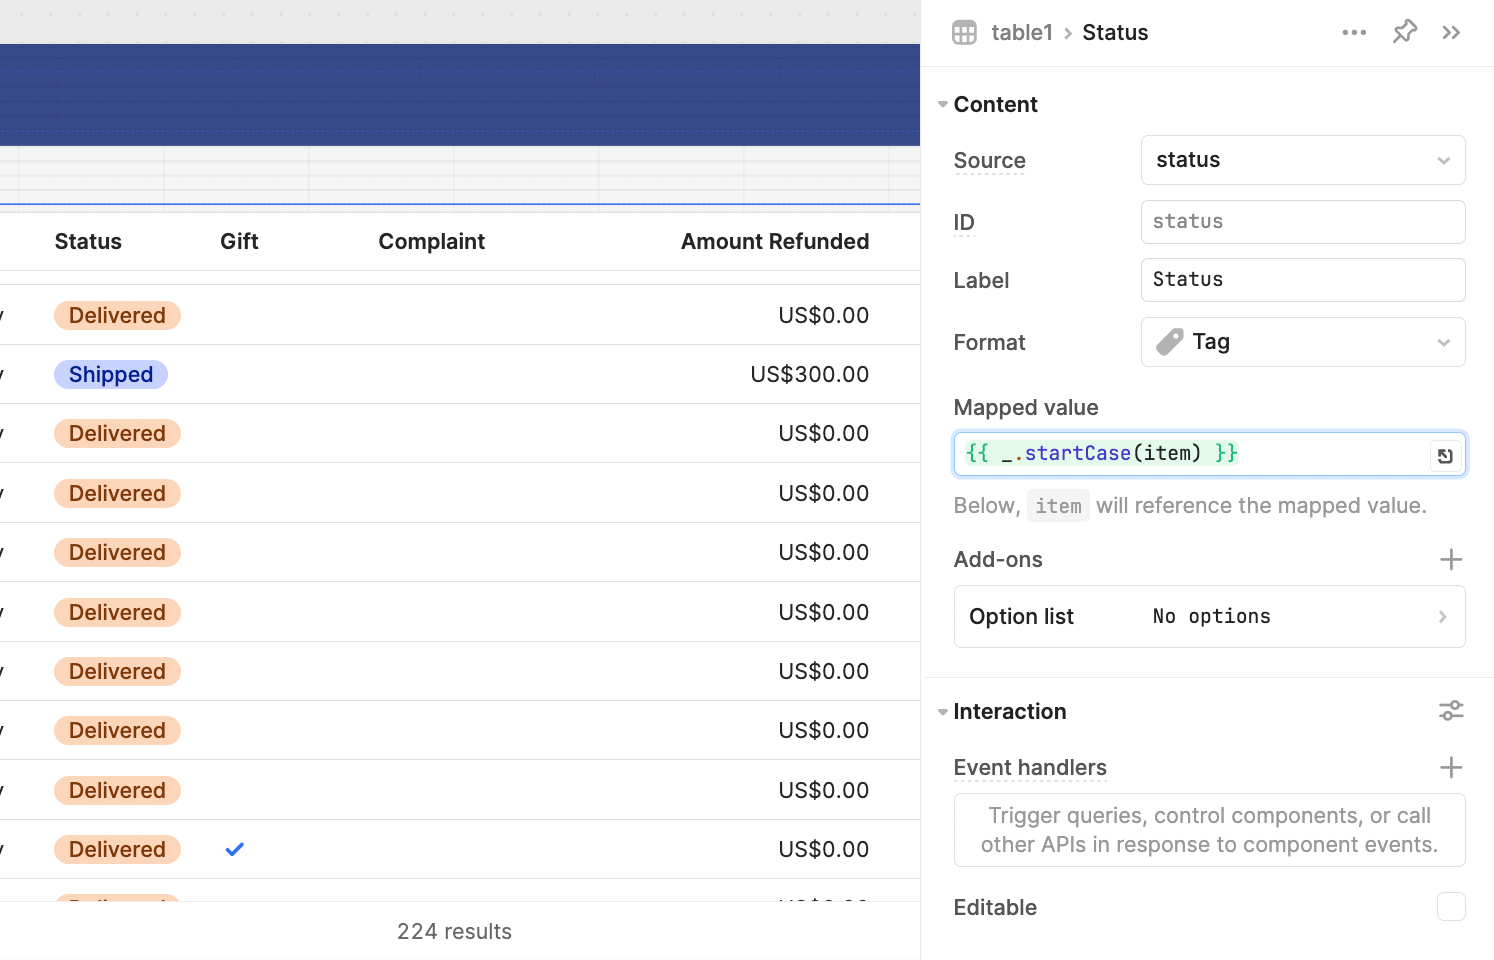
When you click a column in the Inspector, you open the column settings. Here you can change the column title, and format. For this column we selected ‘tag’ to present with a clear, colored tag for ease of use. Since the value in the backend was lower case only, we also mapped the value using Start case to look neater with a capitalized first letter. Here you can also add interactions and more options to further customize the table functionality.
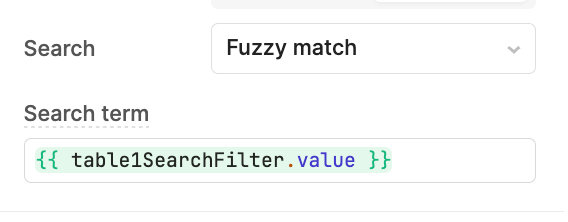
To search for values in your table you can use the \'AI\' Quick actions (the purple star that appears next to your table component) to generate a search filter. This will pull in a text input to search from, and will set the table to search by the value of that component automatically. ‘Fuzzy match’ is the least sensitive search option that will return the most values.
To add some more filter options by Delivery Status, pull in a multiselect component. In this case we manually programmed the multiselect options, but these can also be mapped from the database options, with some code like the _.uniq Lodash function. Note, the multiselect values must match the values in your database exactly to work.
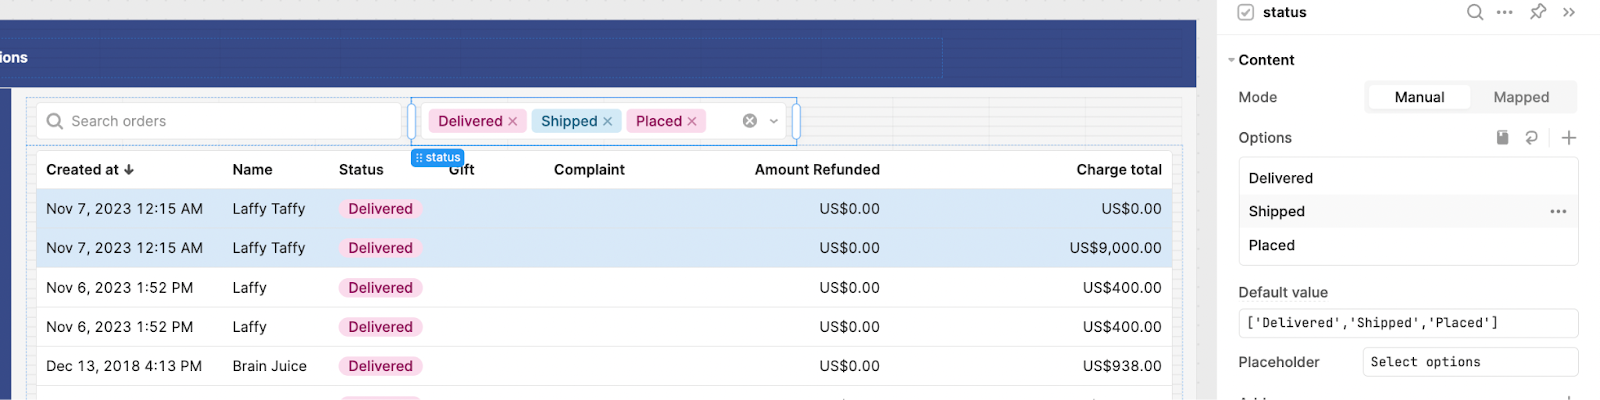
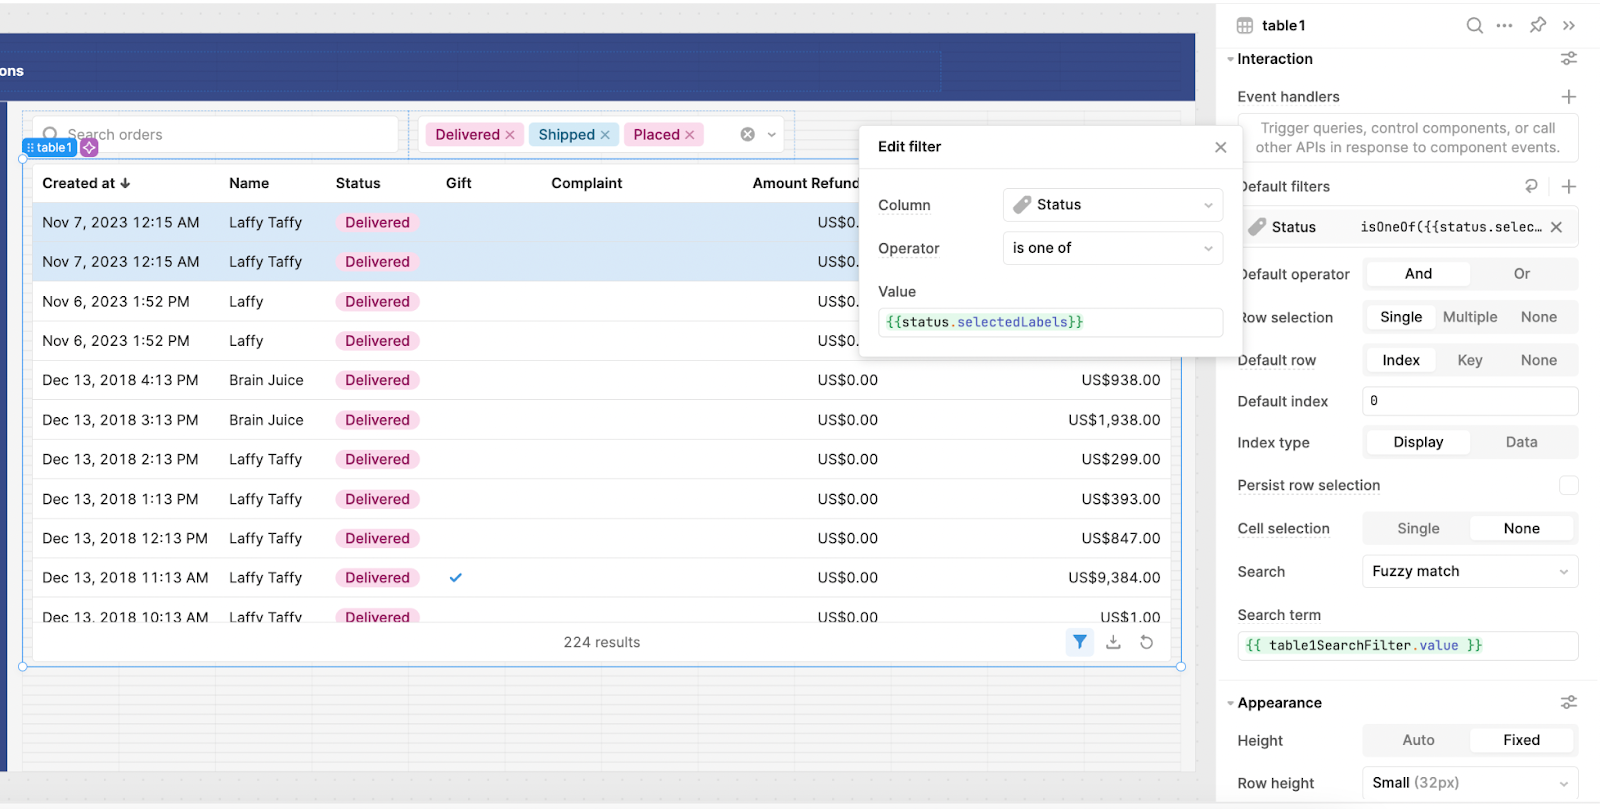
To allow this multiselect to filter the data by tags selected, we simply set the Status column filter to be ‘one of’ the selectedLabels of the status filter.
Now we have a pretty good-looking app, with a table to display data and some filters to sort through it. Let’s add the ‘C’ option in our CRUD app, with a function to add new orders.
Step 3: Add new order function
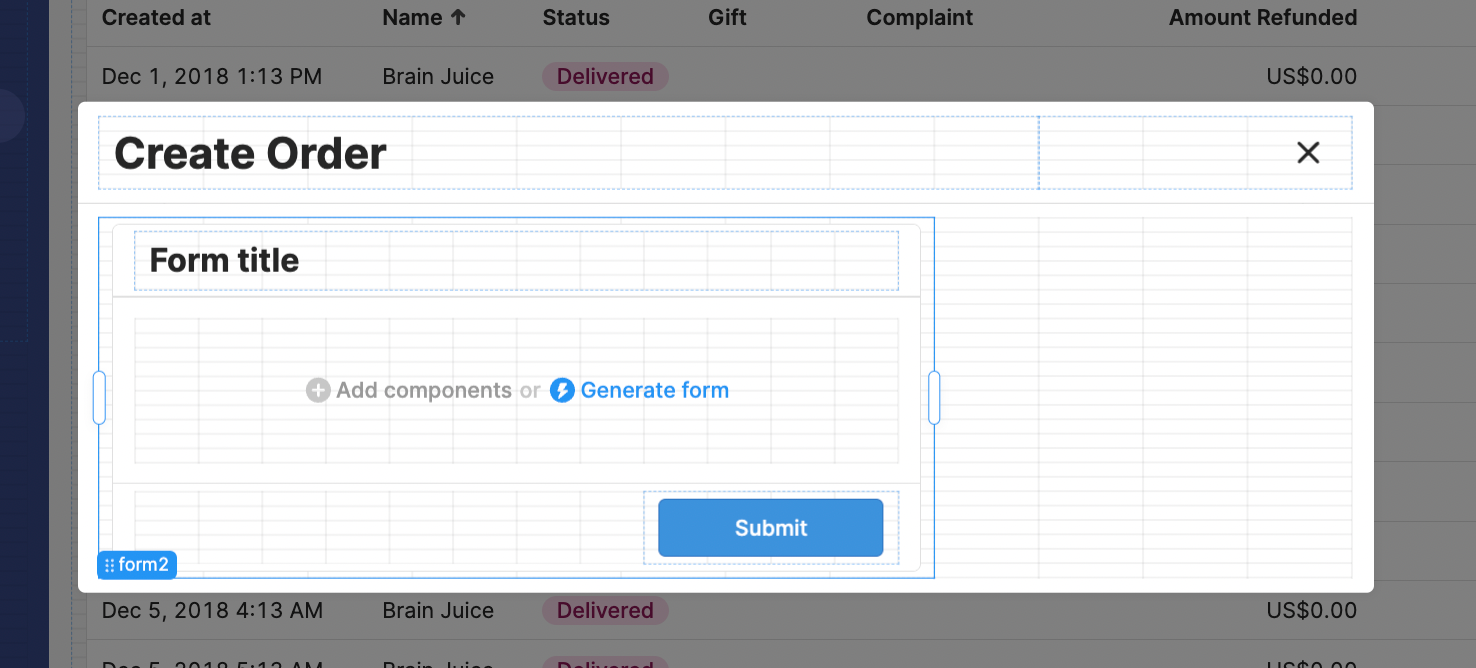
From the components, pull in a modal and set the button text to something like \'Create Order\'. Add a title to the form for better UI. To create the actual form, pull in a form component, where you can use the smart ‘Generate form’ option, that will take the schema of your database to create an input form.
In the form generator, you can select the columns you wish to include, define the labels and input type, as well as whether or not they are required. This can all be edited afterwards in the form inspector.
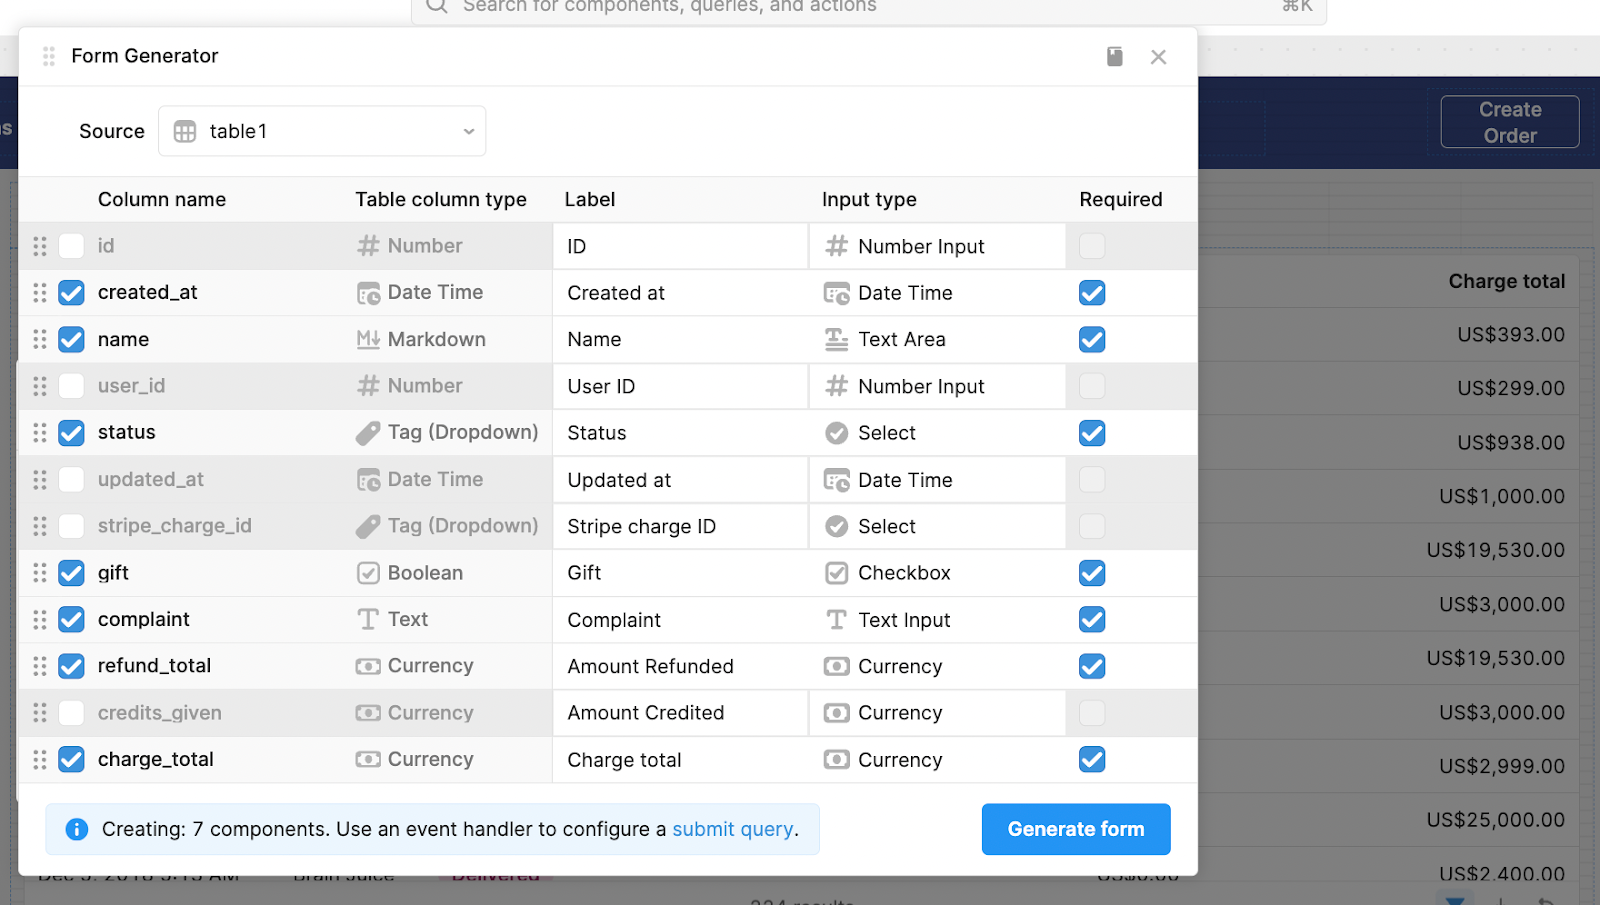
Once you have generated the form, you can edit the components individually in the inspector, as we have done to define the possible options in the Status dropdown. This is also where you can set data validation rules under the ‘Interaction’ section, to stop users from inputting false data types. You can set each option to be a Select (dropdown) component to avoid incorrect inputs and set the input type to only allow numbers/URLs/emails and more.
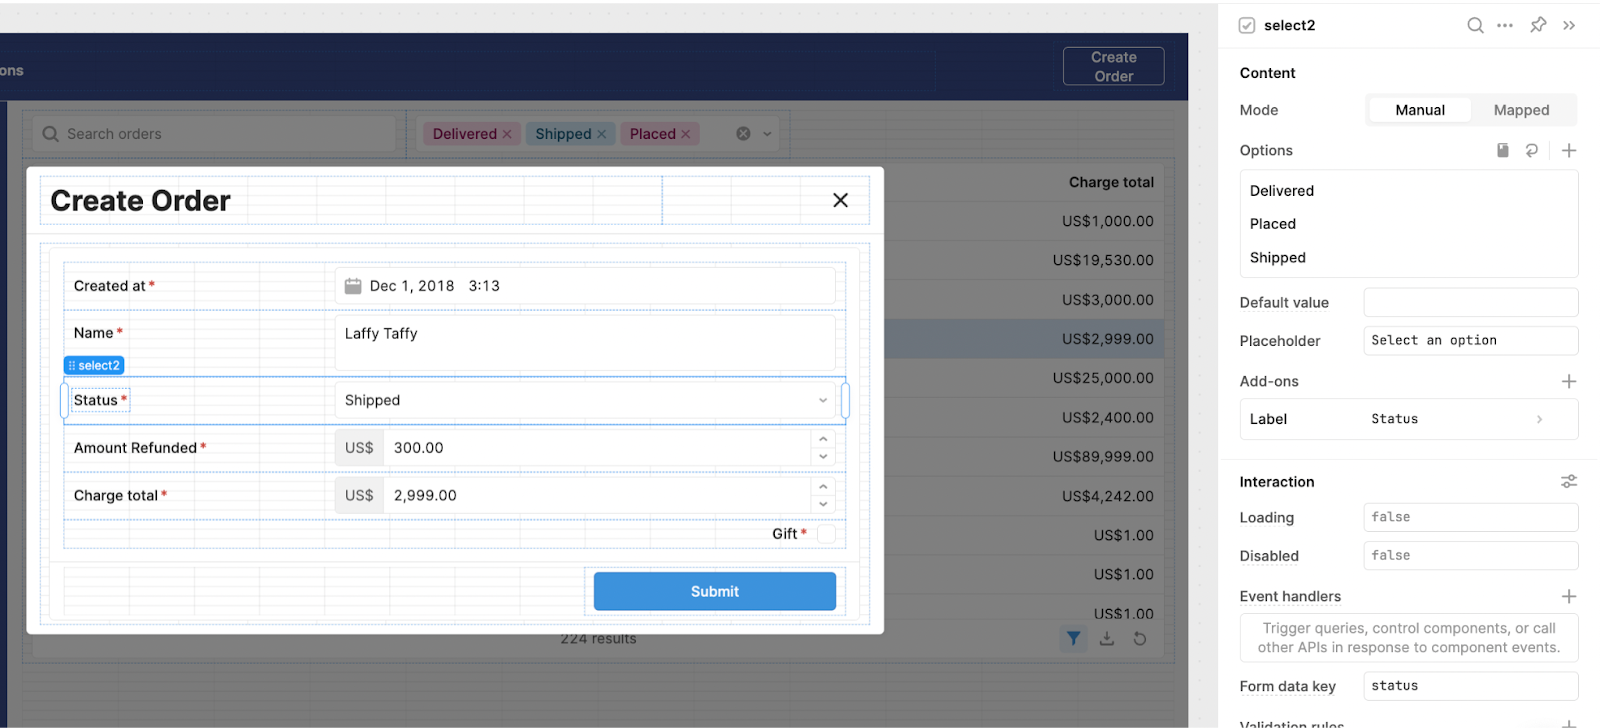
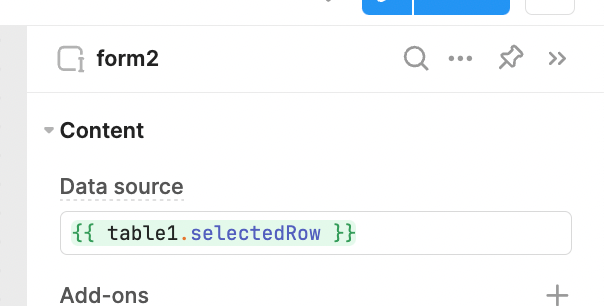
Since the data source of the form is automatically connected to our table data, it will default some of the values. You can disable this by deleting the reference, but you might find it a good option for filling out forms faster - read more about improving the UI for forms in our guide.
Next, you need to add a query to create a new row in your spreadsheet with this data.
You’ll add a new query in the code section as you did before, but this time you’ll set the query Action type to be ‘Append data to a spreadsheet’ - essentially, add a new row. Use the same Spreadsheet and set the values to append to be the values of your form.
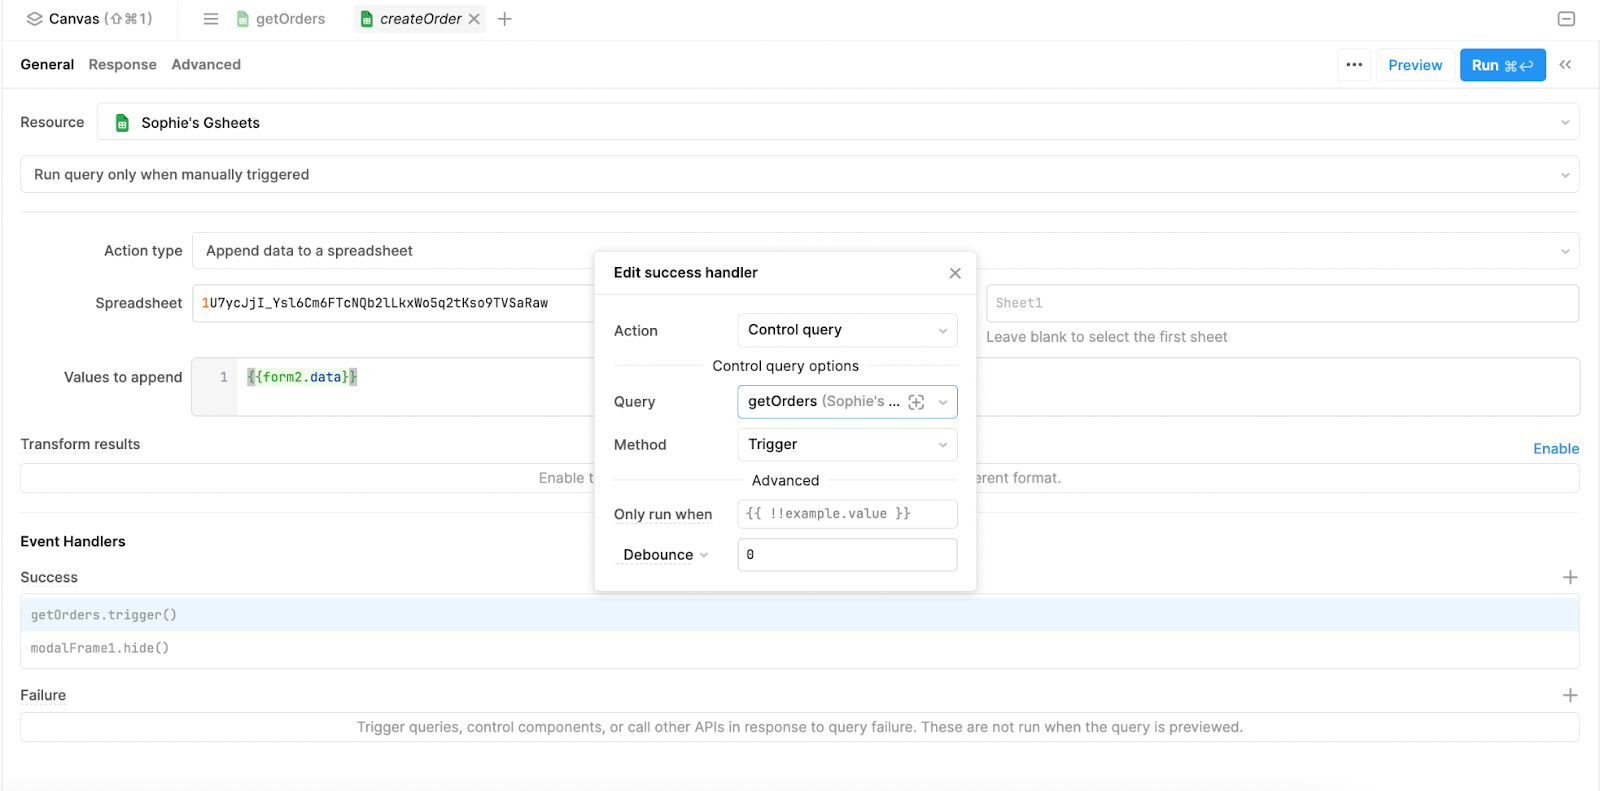
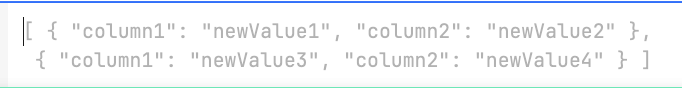
Since the form was generated from the schema of your spreadsheet ‘database’, the data is automatically mapped to the correct columns back in Google Sheets. If you haven’t generated the form from the database schema, you will need to define the component values and their respective column headers like so:
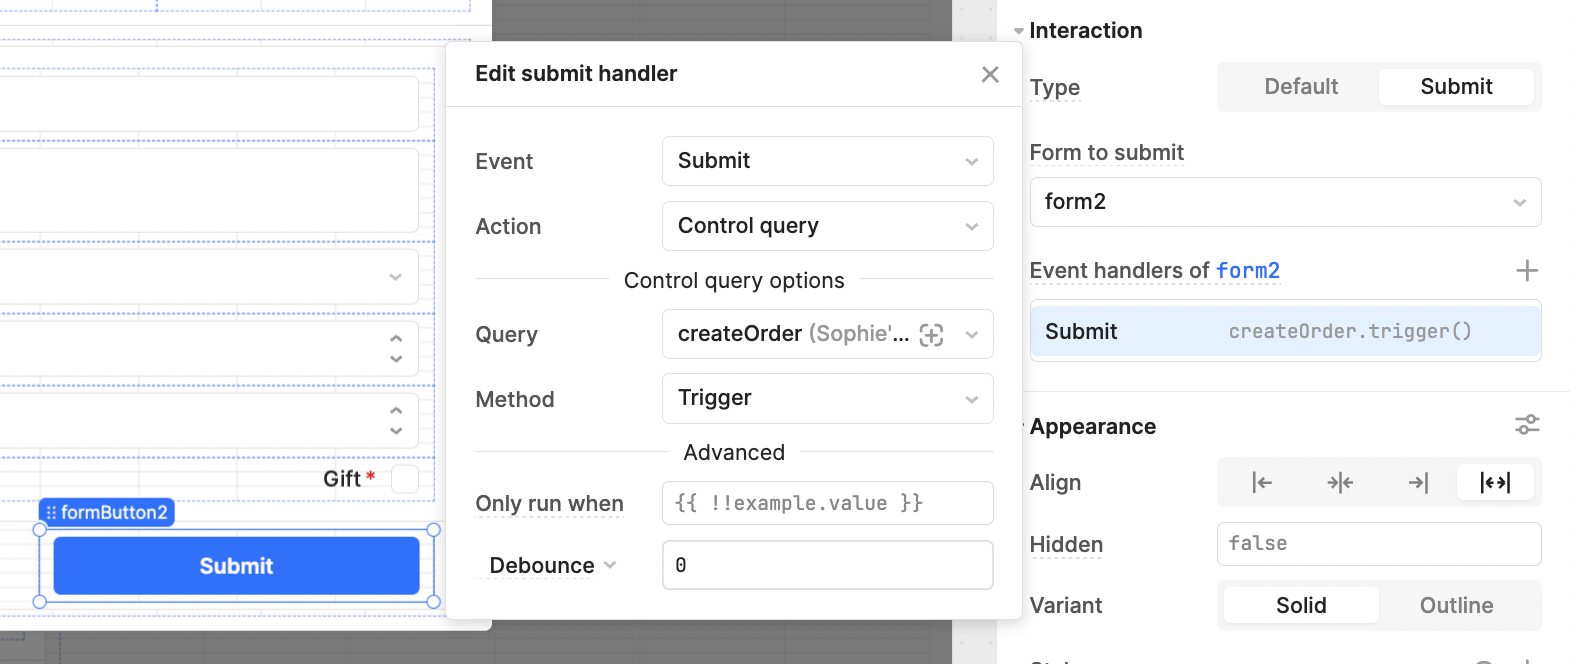
Finally, set the event handlers to trigger the \'getOrders\' to update on success, and to hide the modal component, as you can see in the image above. This way the data stays up-to-date and you don’t risk someone resubmitting the form and duplicating the order.
To finish setting up the form, return to the button and add an event handler to trigger the query to run on click:
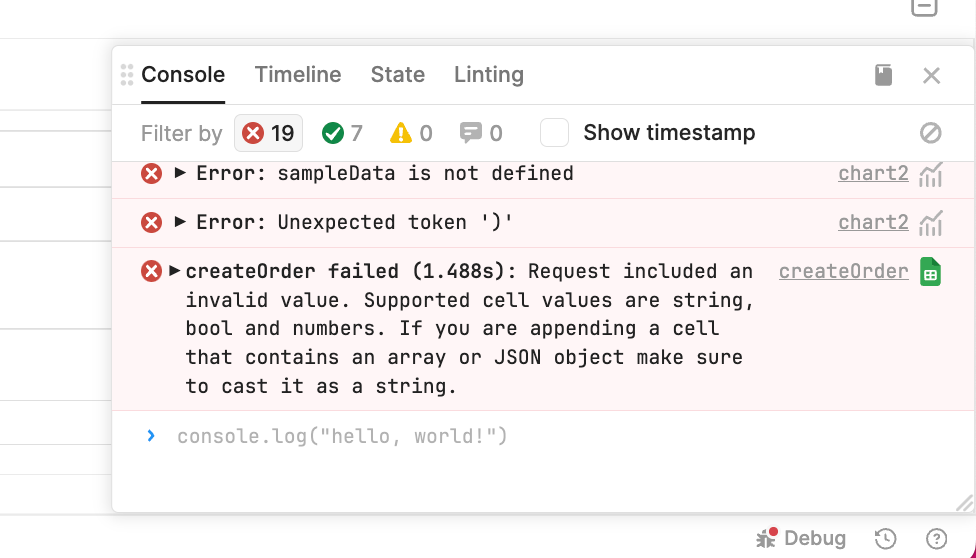
It’s helpful to note at this point, that the debug console in Retool returns very useful information to help understand what might be going wrong with your queries. Here you can see that a fault in our createOrder query generated a very detailed response from the Google API that helps even non-technical builders to fix the issue:
Next up, let’s repeat these steps, but this time to make an ‘edit’ form to update the order info.
Step 4: Add ‘edit’ form option in drawer frame
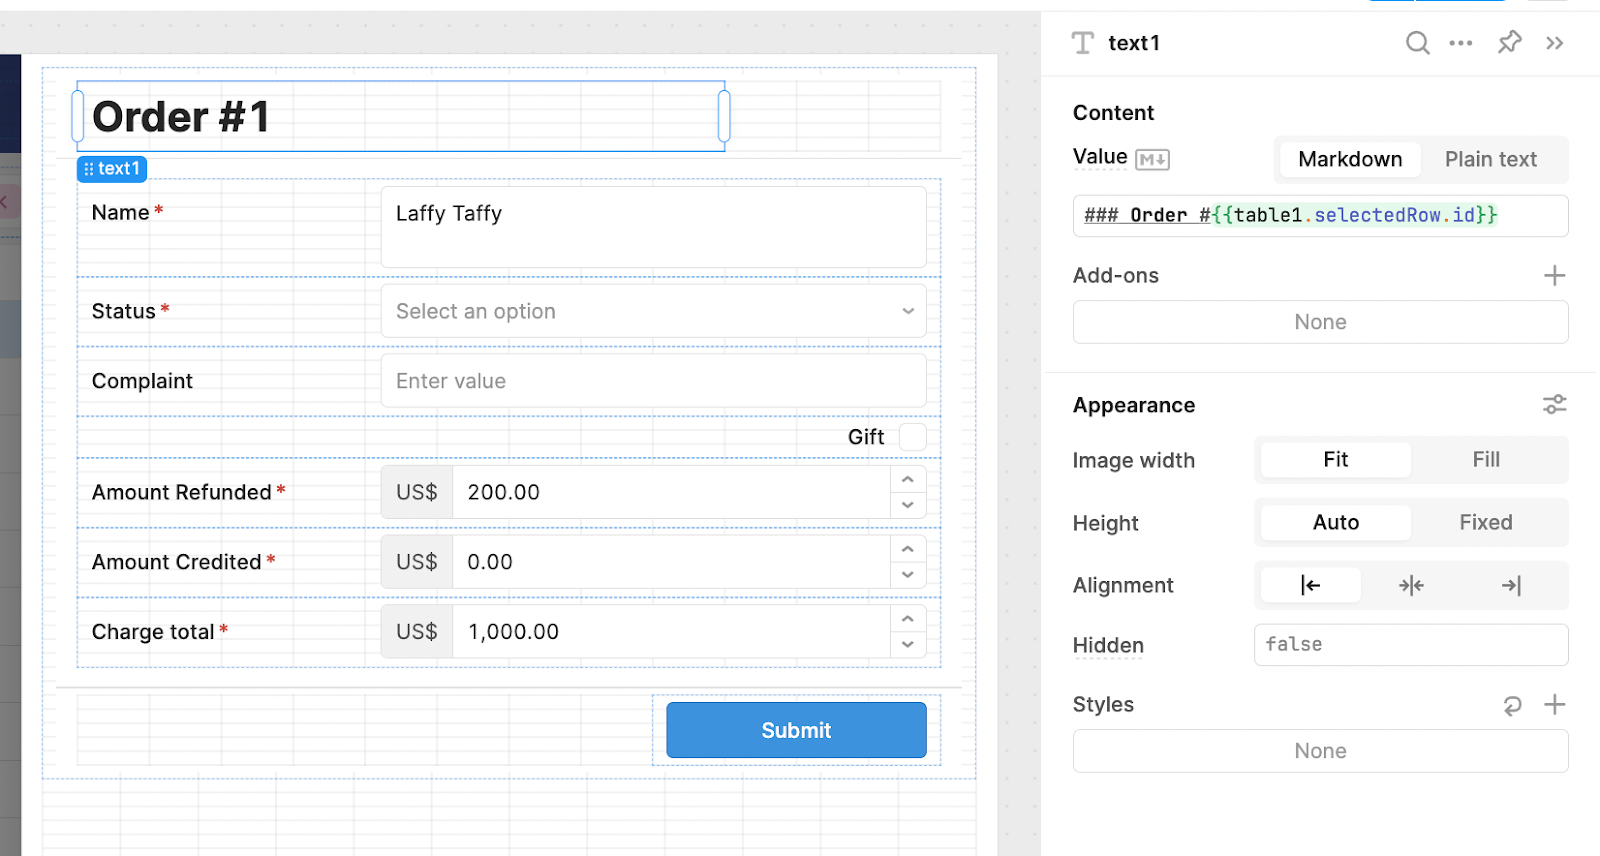
First, you’ll need to open the Component tree option back up and ‘Create’ a drawer frame. In the drawer frame add another form component and auto-generate it in the same way you did for your first Add order form.
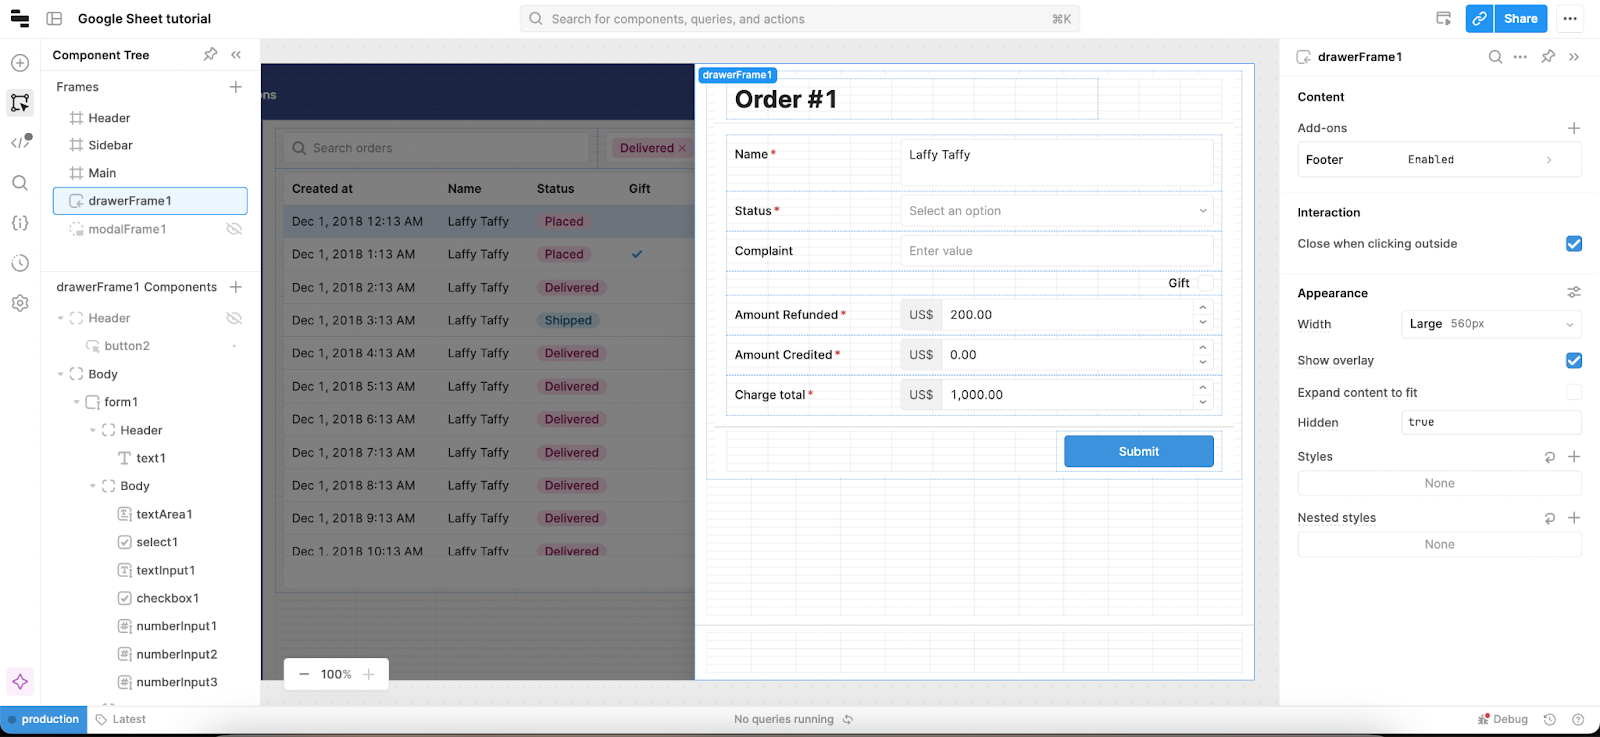
To set a dynamic title that reflects the selectedRow in the table, you can set the textbox to reference the ID, order name or whatever value you’d like.
Now we need another query to update the values. Add one more new query and set the Action type to ‘Update a spreadsheet’. Set the filter to be according to the id (or another unique value each order has in the spreadsheet) and then set the update values to be the form values.
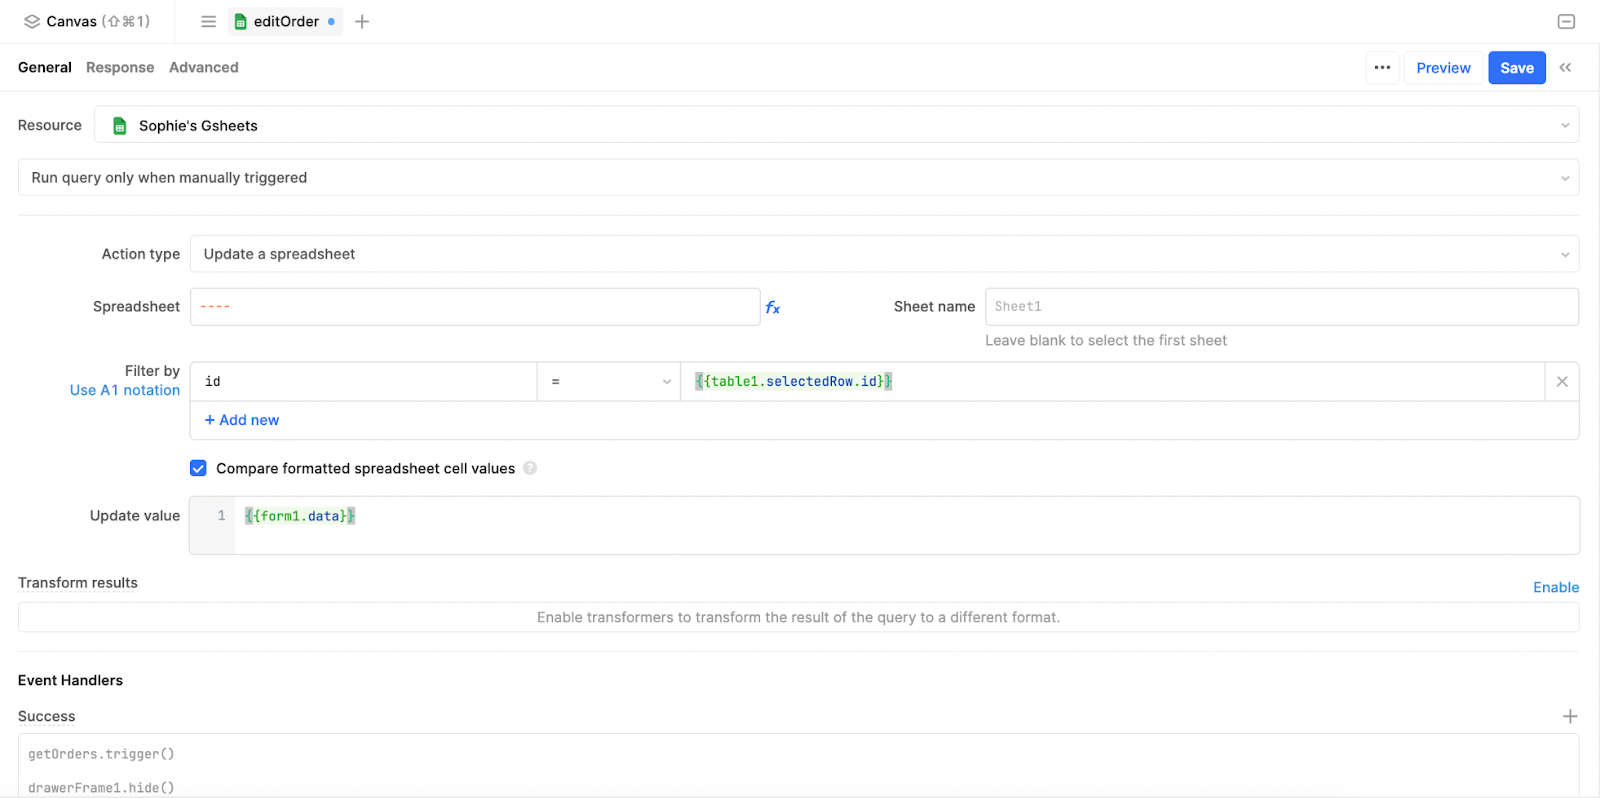
As before, to keep the UI tidy, add an event handler to close the drawer on success, and trigger the getOrders query to refresh the data.
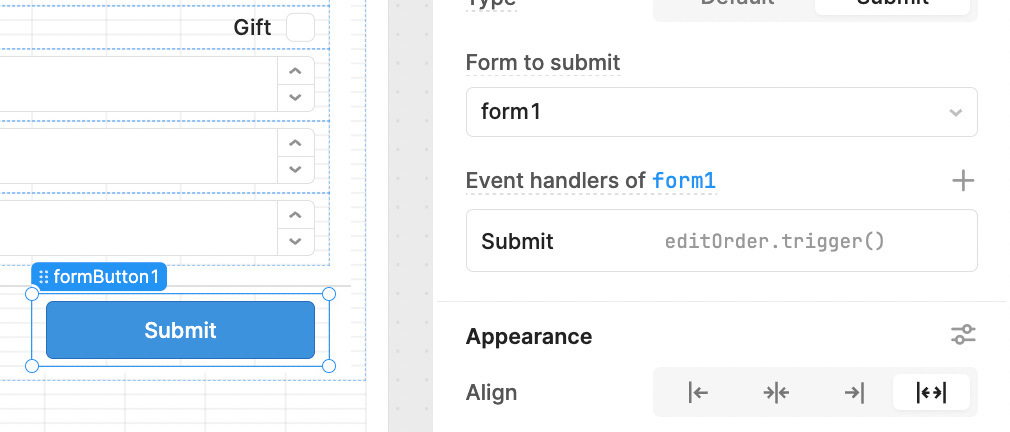
Finally, pop back to your form ‘Submit’ button and add the event handler to trigger the query on click.
Finally, you need the ‘edit’ button for the users to open the update order drawer frame. For this, we used the Actions option in the table component, which allows you to add buttons that appear on hover of the selected row. We set the Label and icon to be intuitive to use, and set the action to show the ‘drawerFrame1’ component.
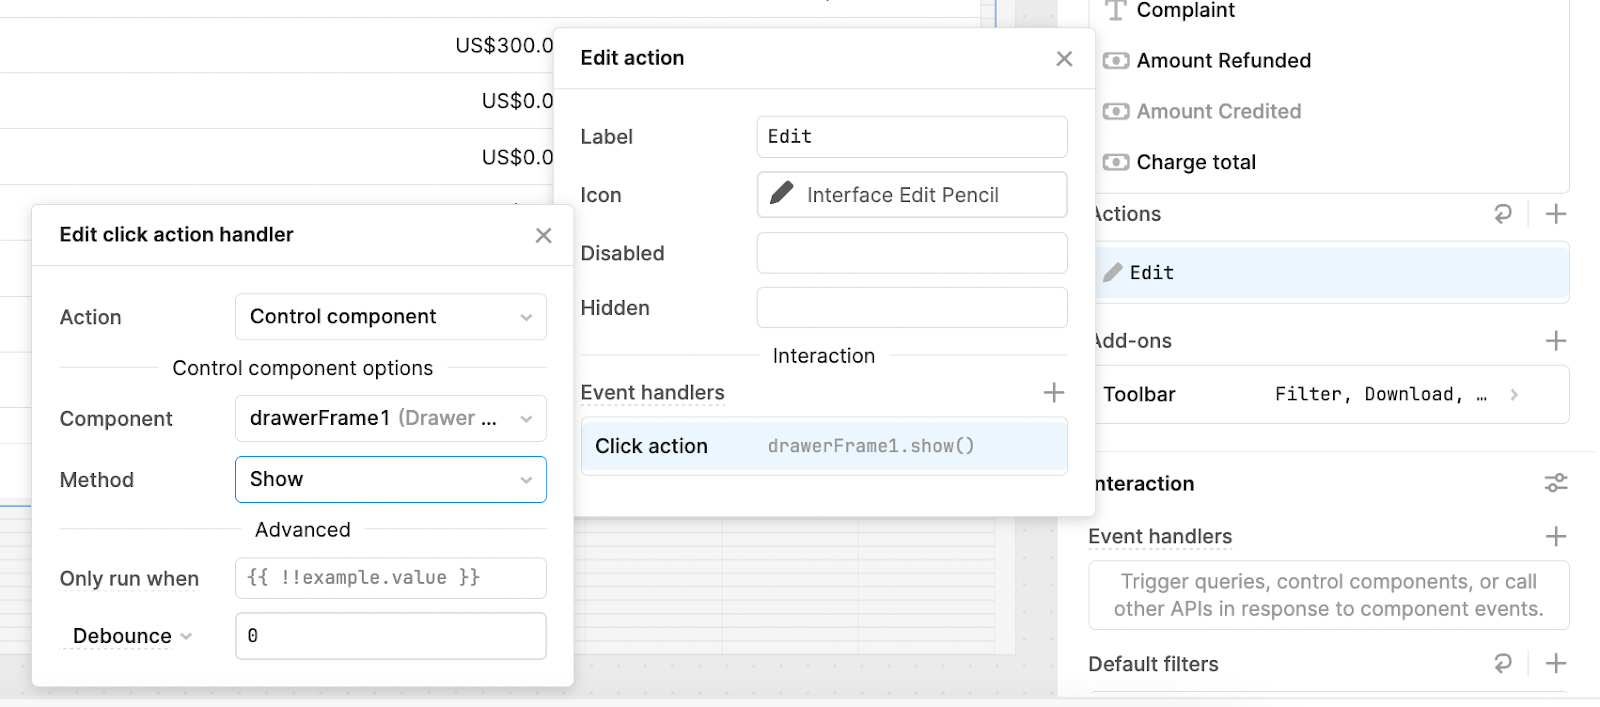
Now, when the user hovers over a selected row, they see the edit icon to trigger the form to open.
For the last step, let’s add some simple charts to summarize the data in the table in a clear and useful way.
Step 5: Delete a record
Now it’s finally time to hit the ‘D’ in CRUD: Delete. To keep this button a little tucked away (and therefore avoid any accidental clicks), we’ve put in the Edit form like so:
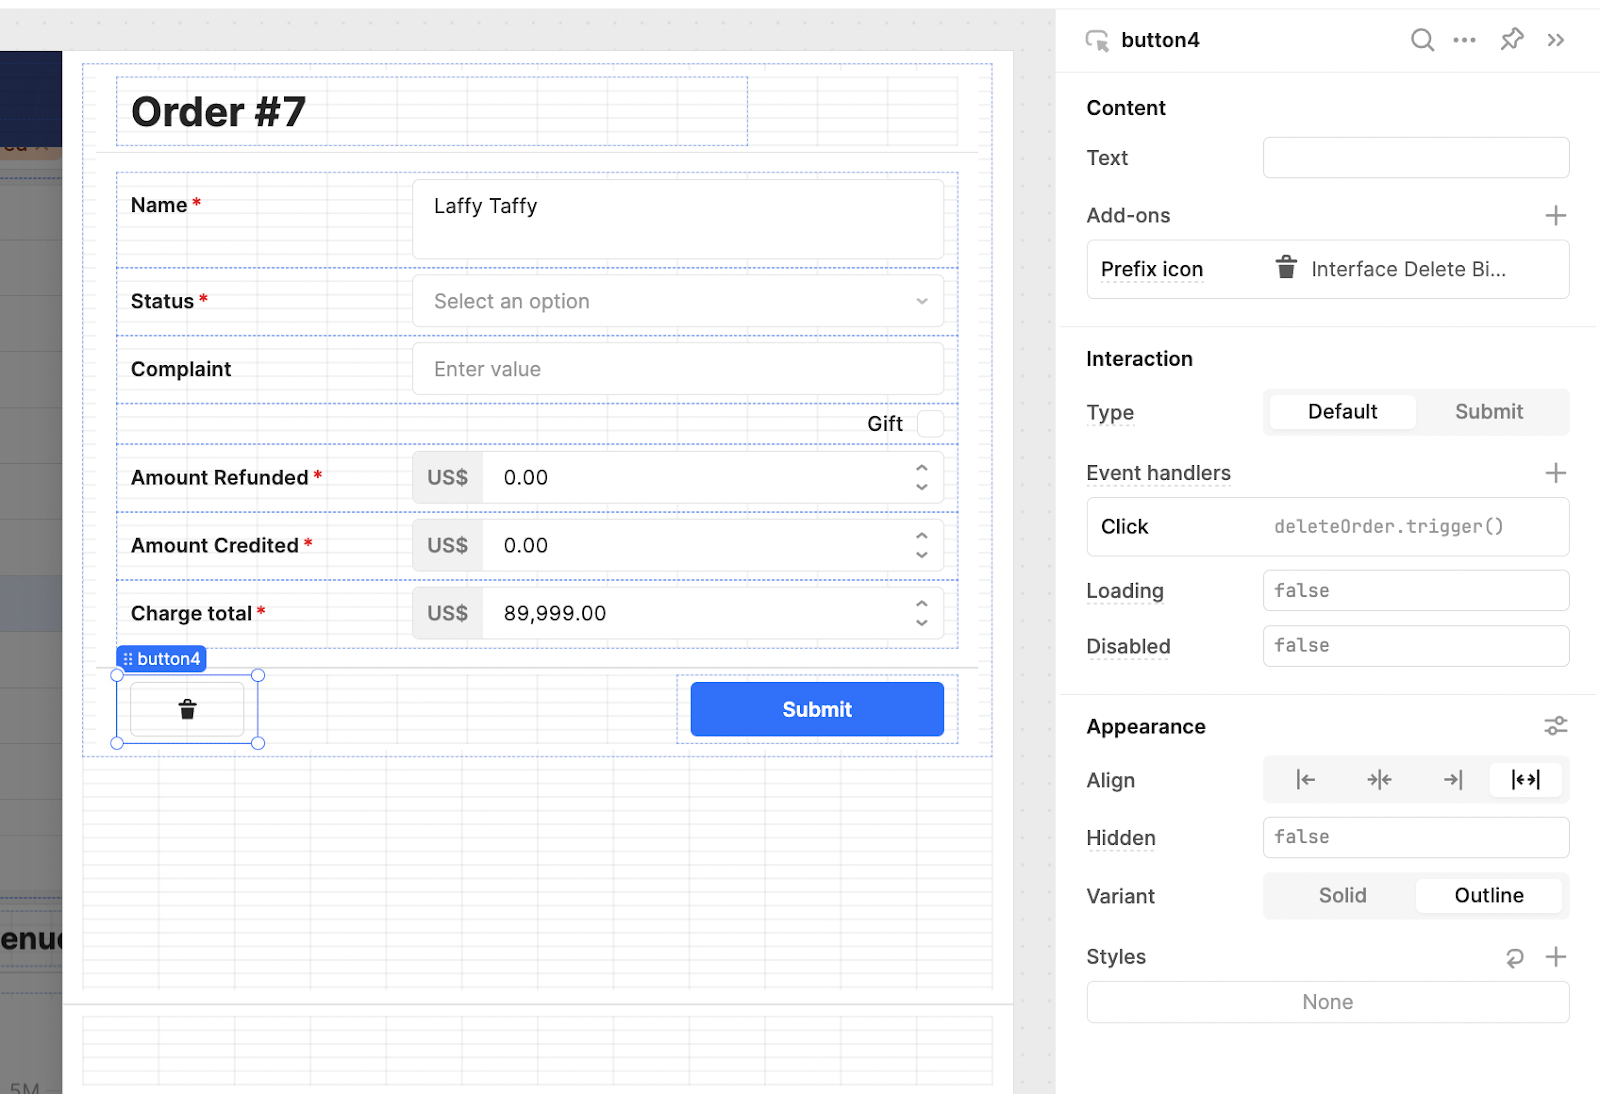
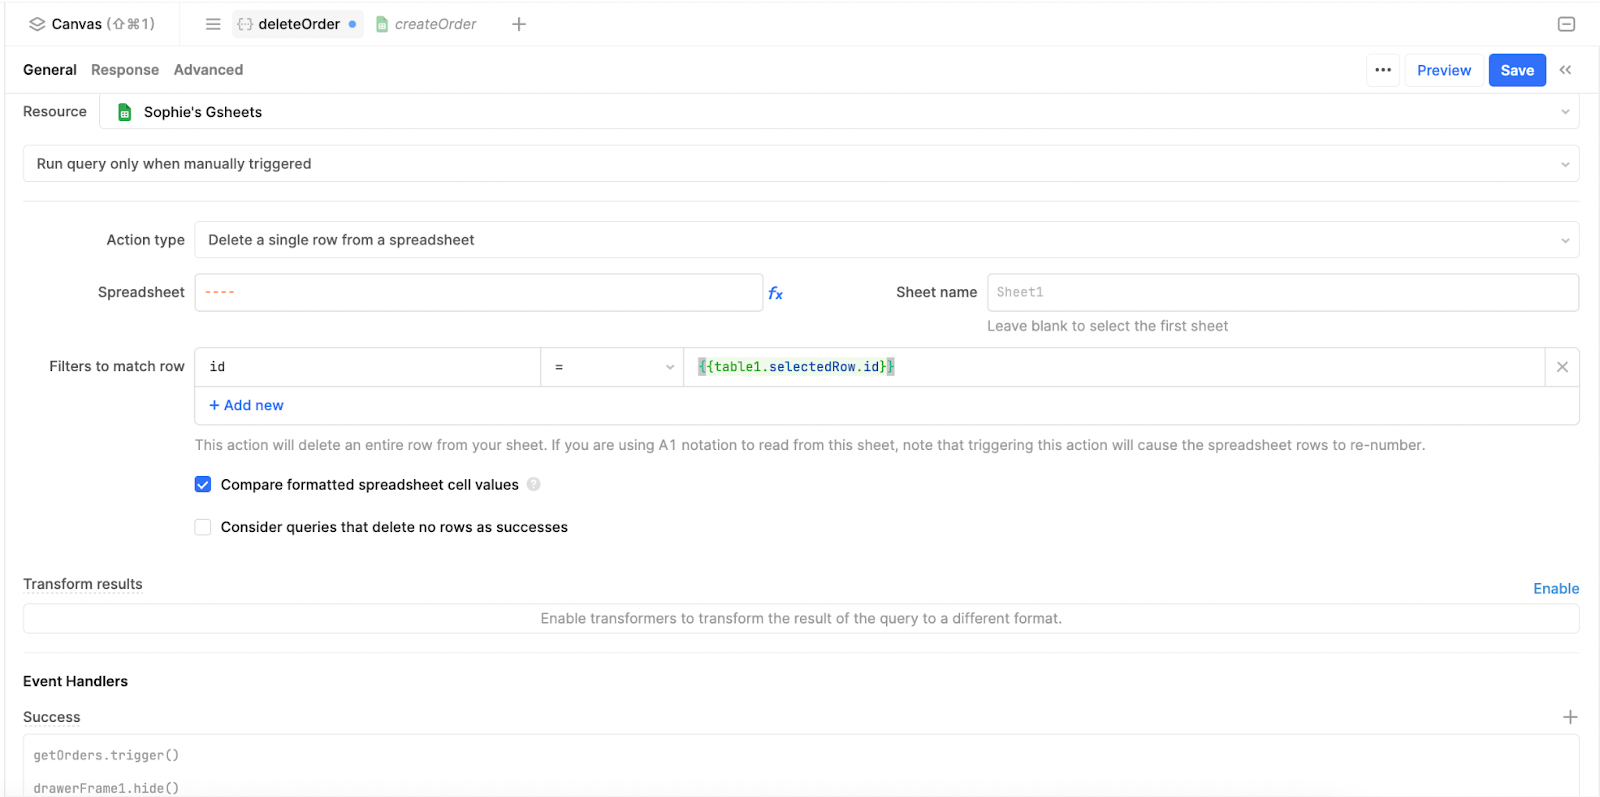
This button is positioned slightly out of the way with a secondary button style (learn more about button UI in our guide) to dissuade accidental clicks. In the event handlers, we’ve triggered the below query, which looks a lot like our others, with the ‘Delete a single row from a spreadsheet’ Action type:
Since delete is such a sensitive action, we’ve added one extra layer of confirmation in the ‘Advanced’ tab to ensure that the user doesn’t misclick.
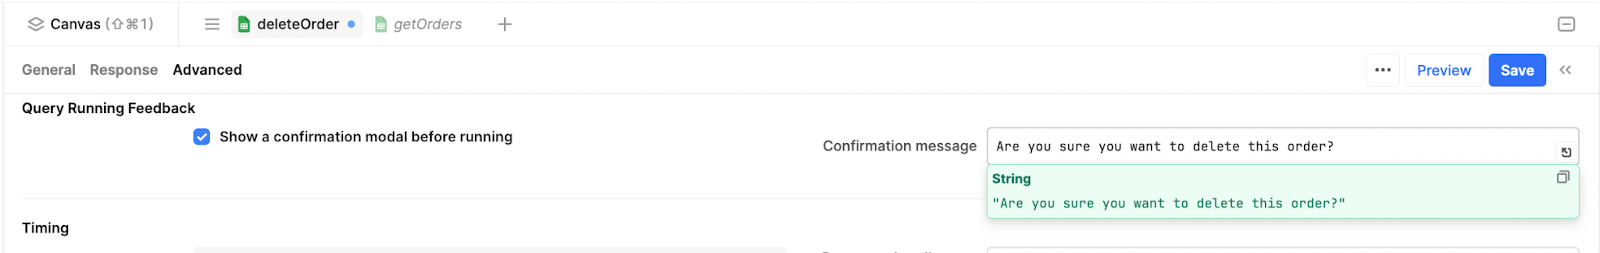
This presents a confirmation message that can avoid any risky mistakes:

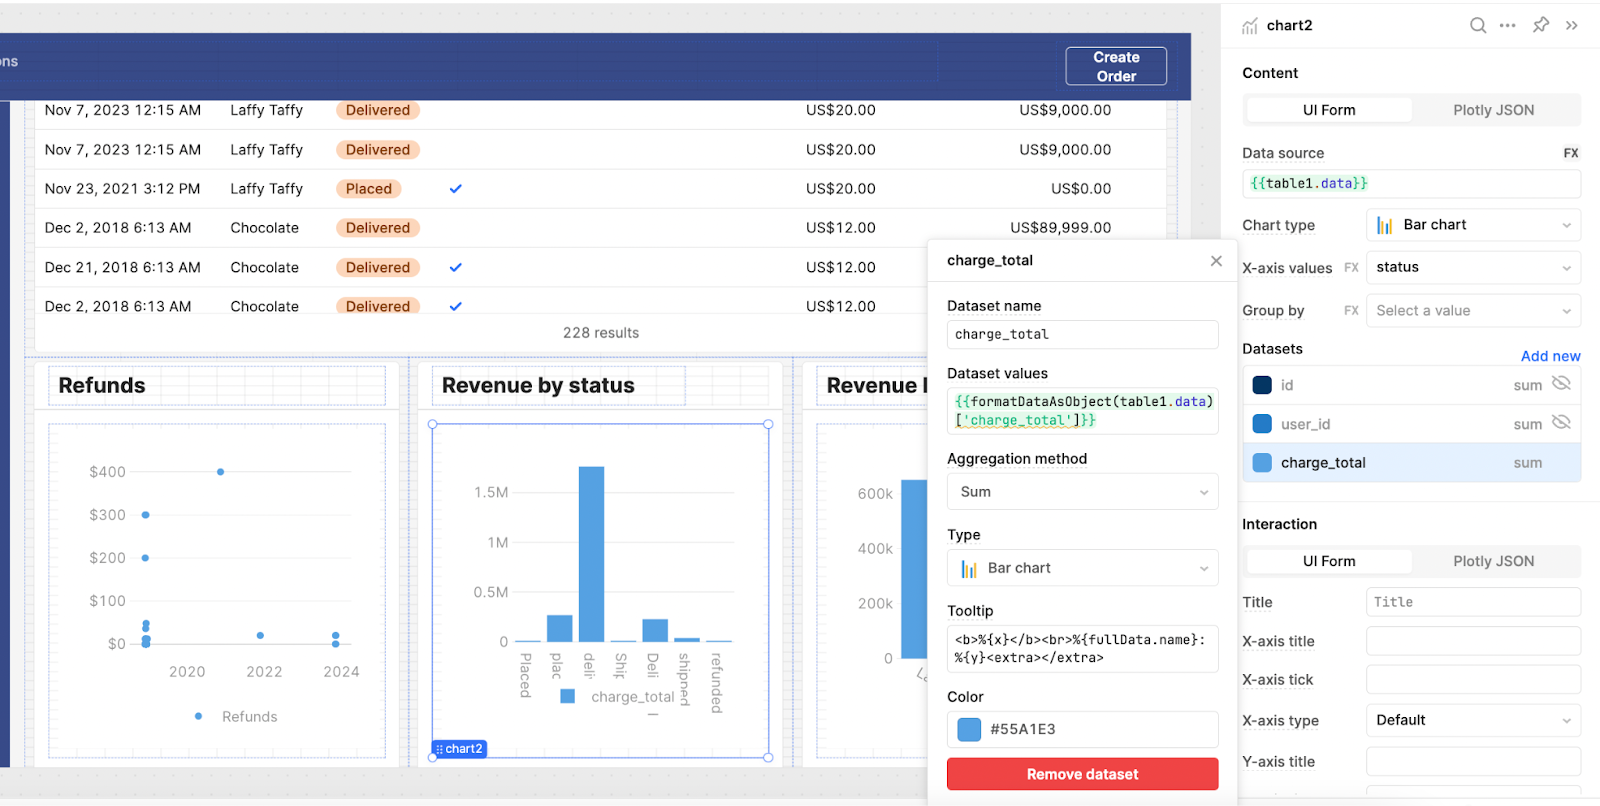
Step 6: Add charts to present data
To display the data, pull in three containers and change the headers to indicate the chart values. Then add a chart component to each container.
For our data, we connected each to the table component. For the status chart, we selected the Status values as the X-axis values, and mapped the dataset as an object using this code:
{{formatDataAsObject(table1.data)[\'charge_total\']}}This transforms the data into an object that the chart component can sum, to show the total charge by category.
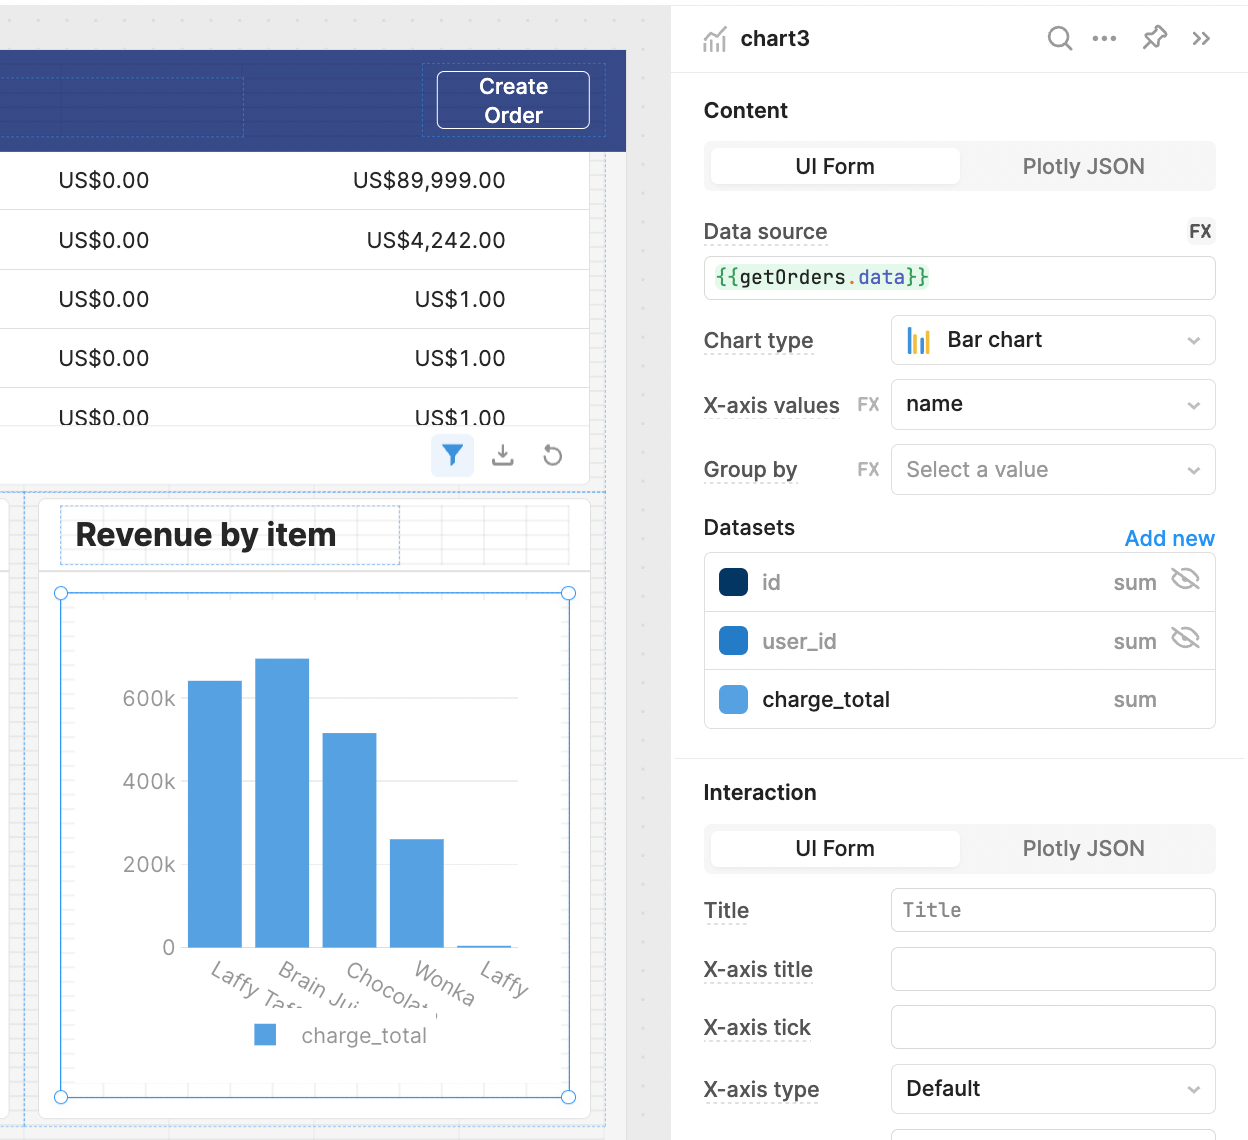
We did the same for the other charts: for revenue by item we set the x-axis to the item name, and the y values to the sum of the formatted charge totals (as we did for the previous graph).
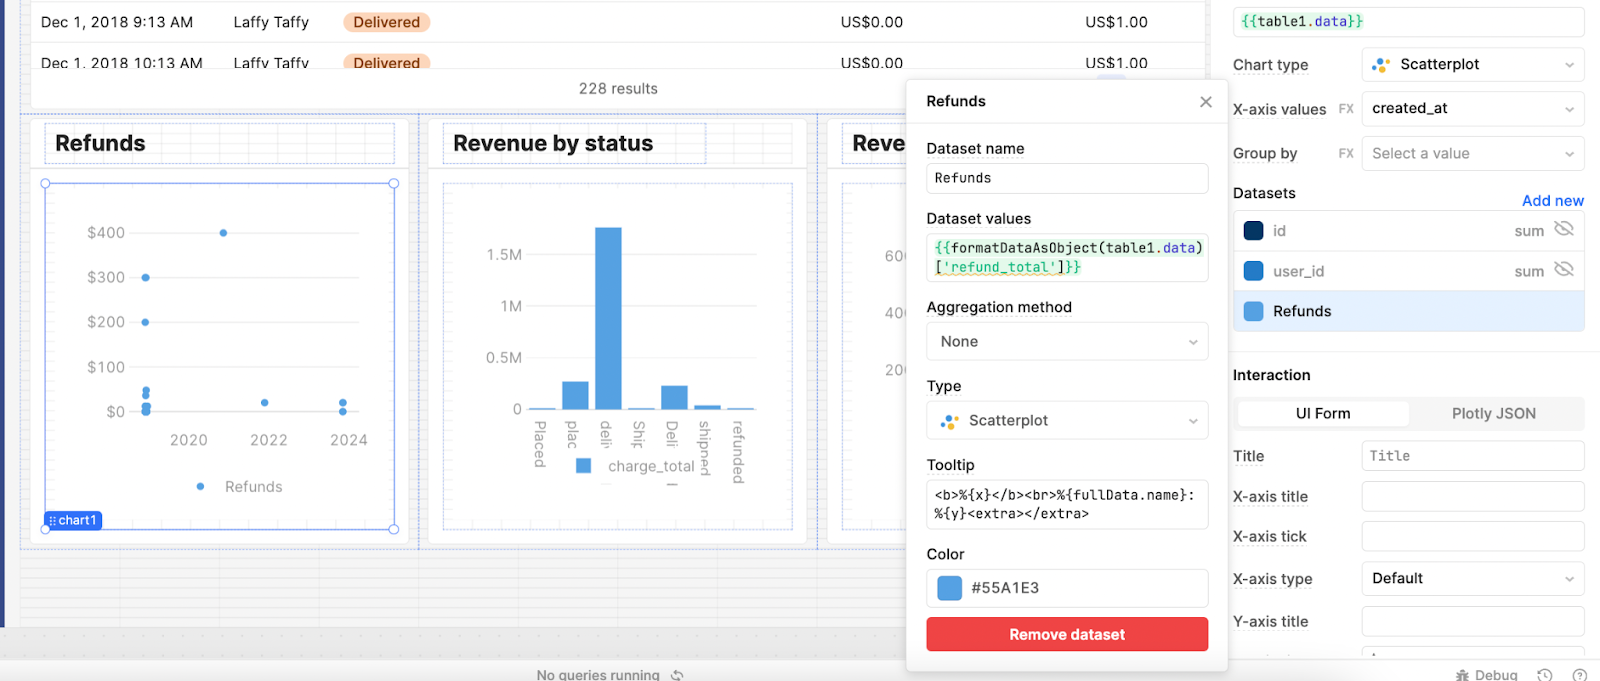
For the refunds, we set the chart type to a scatterplot, set the x-axis to the created year and the y axis to the sum of refunds. The scatter chart helps to display the kinds of refunds they issued across those years.
And with that, you have a simple app built on top of your Google Sheets data that allows you to display data in a table and charts, create and update records with validated data (no one can input the wrong data format for instance), and delete records safely. All this is much safer than working entirely with a Google Sheet, where actions are not traceable or validated.
Looking for more app-building inspiration? Check out our blog for more!
Want to learn more about internal tools and how to build them? Check out our sections on low-code tools like Notion and Airtable, or developer tools like Retool and Windmill.

