


As part of our Charting in Retool series, we’re stretching the limits of Plotly to create some incredible and functional charts to use in our apps in Retool.
In Part I, we reviewed some of the Plotly basics and how to set up some functionality around the line/scatter graph type of chart. We showed you how, by coding with Plotly, it’s possible to create highly custom charts, with built-in functionality like range sliders, buttons, and annotations. Integrating these with your existing Retool apps makes these charts even more useful and interactive.
In Part II, we’ll be sharing a case study of how we built a complex Sankey generator with a super user-friendly interface. You can use it yourself at sankeygenerator.com.
Building complex charts in Retool with Plotly - building a Sankey generator
So from the simple charts in Part 1, we’re now moving to some much more advanced graphing, to share an app we built to create complex Sankey charts.
If you aren’t already familiar, Sankey charts are a way of visualizing flows of data across various stages, presenting a clear representation of the movement of numerical values (such as amounts of money) from a source to a target. Each stage of the process is represented by a node proportional to the numerical value.
You may see various Sankey diagrams used for visualizing personal finance, job searches, or breaking down complex budget flows within a company.
Play around with it yourself and see!
Note: Data is saved only on the front end and isn’t exposed to us internally.
How do Sankey Diagrams work?
There are many options out there for building Sankey diagrams, but few of them are intuitive to use and most offer a complex UI that requires a bit of a learning curve. For this reason, we focused on building a Sankey option with a UI that even a beginner could understand.
Sankey diagrams are often simple to understand, but it’s easy to hit some mental roadblocks once you start building one yourself.
Sankey diagrams can get really complex too - if we take a look at the Sankey diagram below from user ArciticDrag0n on Reddit as an example. There are tons of data points here, but at first glance it’s still easy to interpret the flow of this salary budget.
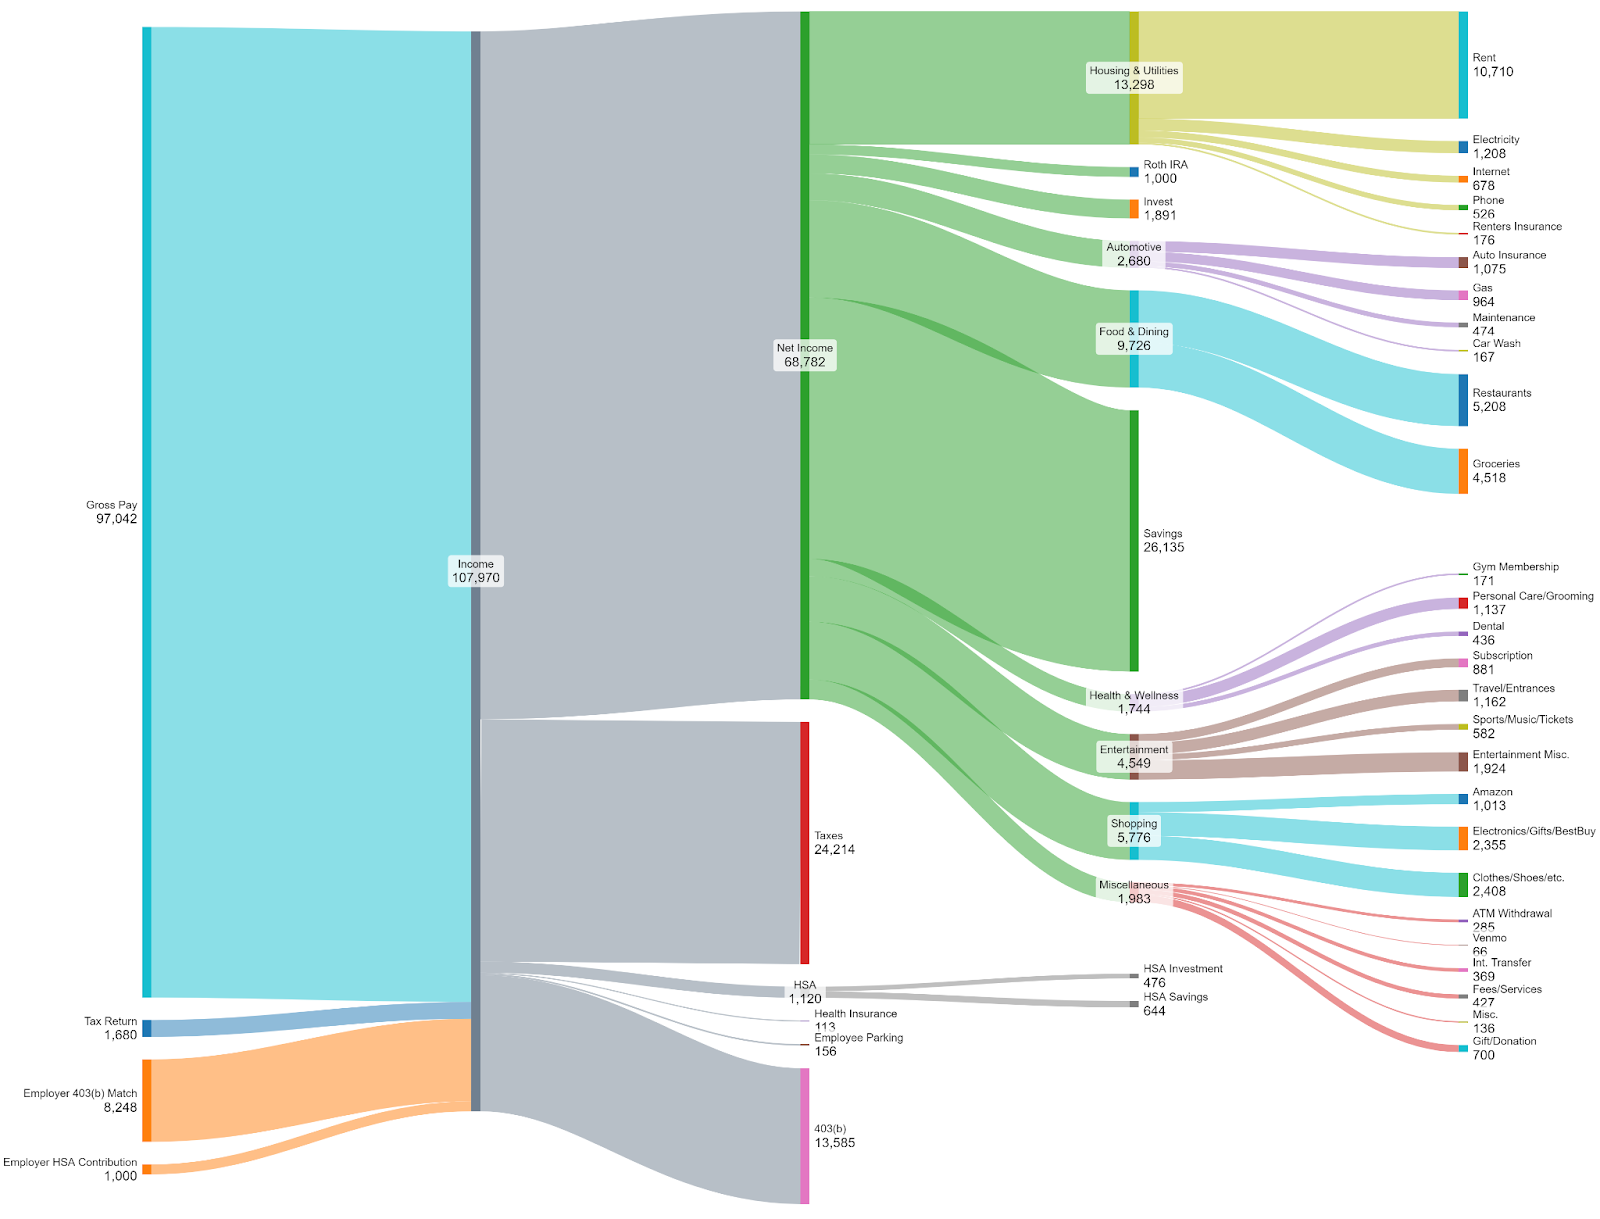
The style shown above is a common way of presenting data flow in a Sankey Diagram: on the left-hand side we show specific inputs or nodes that flow to the right. Gross Pay, Tax Return & Employer Match are all sources of income, and this total income is then broken down into its separate parts, in this case - taxes, net income, and a few other sub-nodes.
When programming a Sankey diagram, it’s easiest to think of the source as the from, the target as the to, and then the value is how much value flows between them.
This is not the only style of Sankey chart out there. Sankey chart flows can double back on themselves and represent more abstract flows of resources and values.
How did we build SankeyGenerator.com?
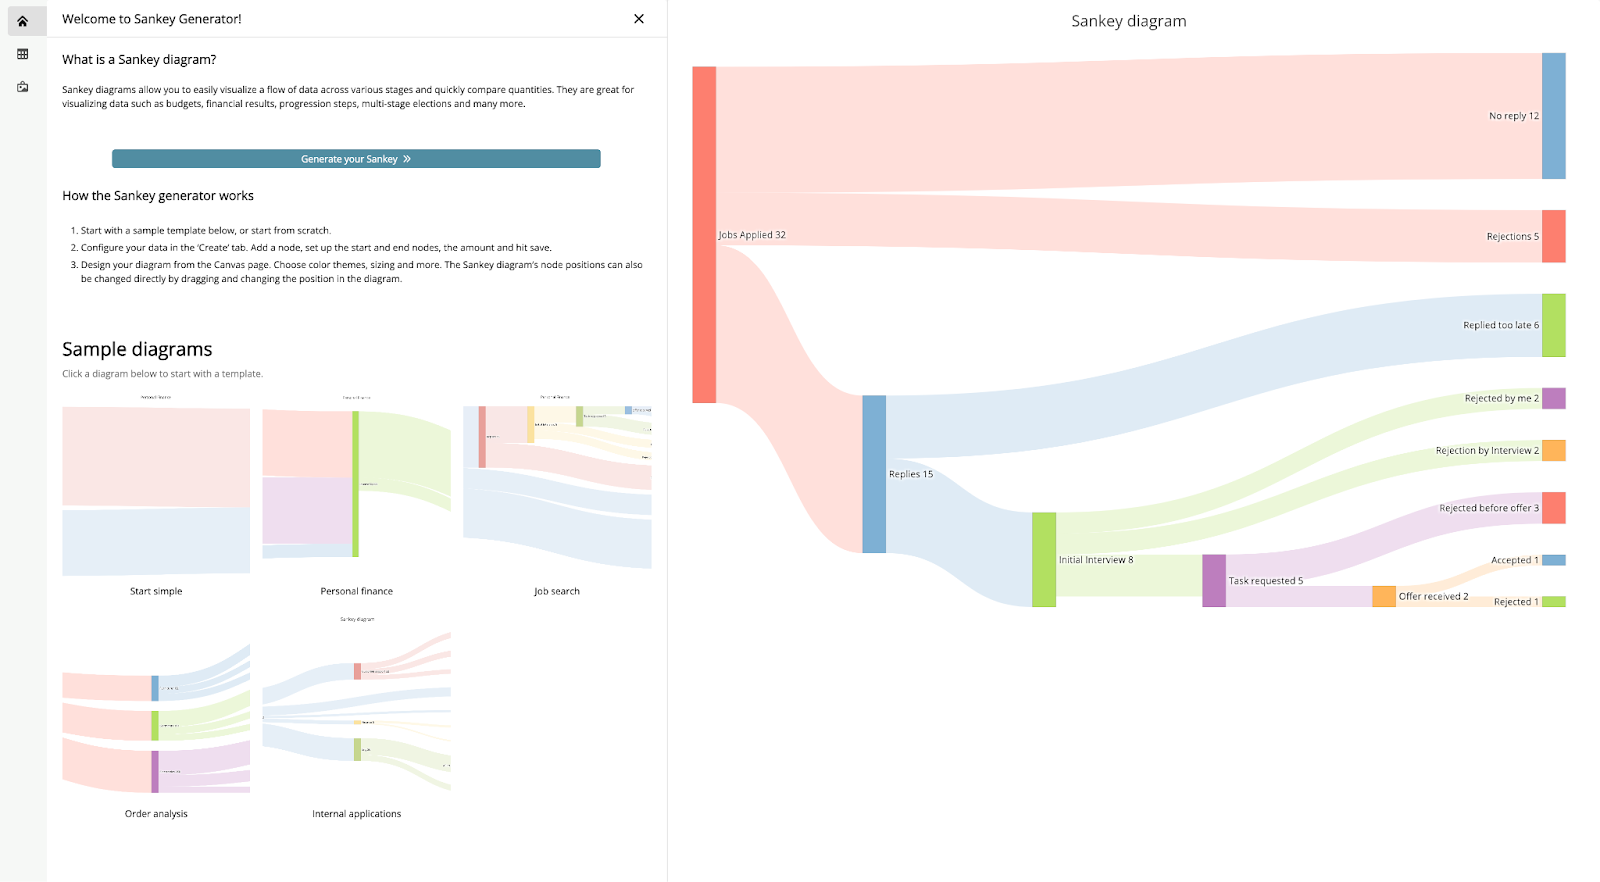
The Sankey generator consists of three sections and a Sankey canvas. The first section is a home page where users can select and preview sample diagrams to be introduced to the tool.
The ‘Generate my Sankey’ button leads to the Create page, where users can configure their own Sankey diagram using a simple table layout, download their Sankey as a PDF or upload a previously configured Sankey diagram.
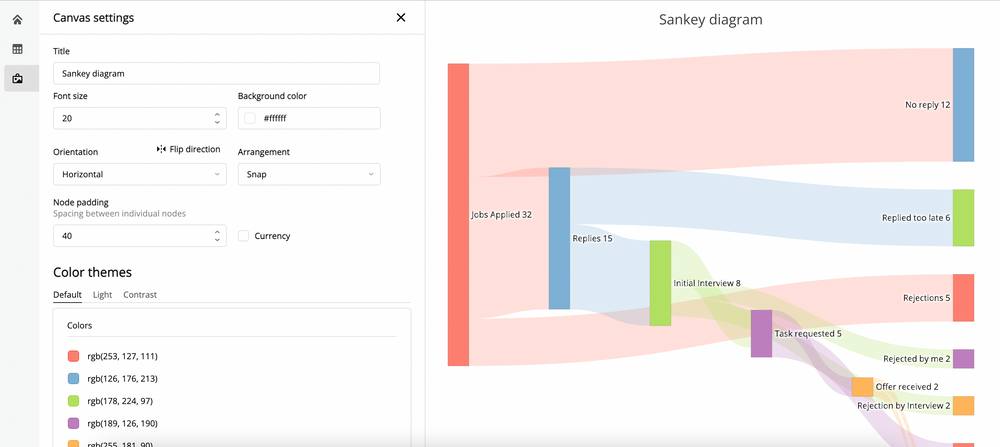
Finally, we have a canvas settings page where users can define font sizes, give their chart a title & more.
Let’s run through some of the core features of this app and talk a little about how we built it out.
Plotly Code
Sankey diagrams are natively included in Plotly using the ‘Sankey’ chart type, and they already offer some great built-in features.
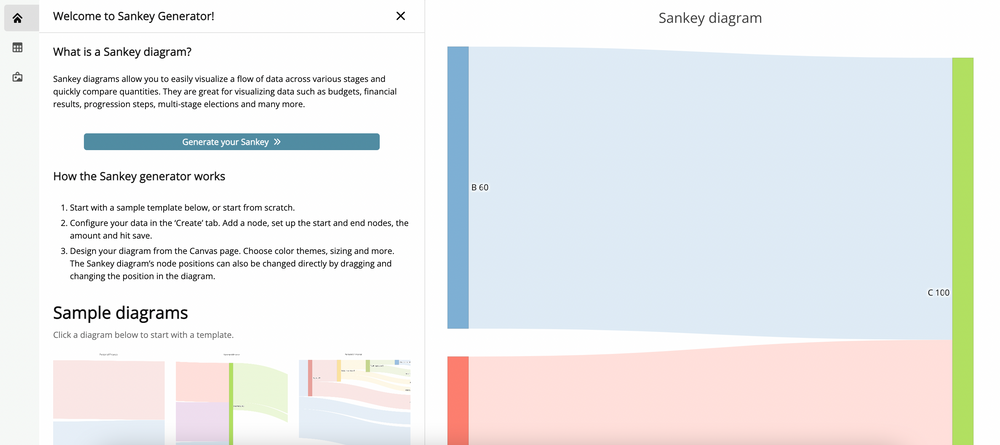
Below is an example of a very basic Sankey diagram from the Plotly docs.
var data = {\ntype: "sankey",\norientation: "h",\nnode: {\npad: 15,\nthickness: 30,\nline: {\ncolor: "black",\nwidth: 0.5\n},\nlabel: ["A1", "A2", "B1", "B2", "C1", "C2"],\ncolor: ["blue", "blue", "blue", "blue", "blue", "blue"]\n},\nlink: {\nsource: [0,1,0,2,3,3],\ntarget: [2,3,3,4,4,5],\nvalue: [8,4,2,8,4,2]\n}\n}\nvar data = [data]\nvar layout = {\ntitle: "Basic Sankey",\nfont: {\nsize: 10\n}\n}\nreturn {data, layout};
You can import this directly into a JS query in your Retool app, and set it up by linking to the data and object values in the chart component - as we showed in Part 1.
What’s particularly nice about the Plotly code is that the node positions within the generator are completely dynamic, so you can move the nodes around to suit the presentation you are looking for. This kind of interactivity built-in is something we love about Plotly.
This is how the base data object of our Plotly code looks. Due to all the functionality in our app, our Plotly code is very complex, and we defined several variables and set functions above.
However, you can see that most importantly, under the ‘Link’ object, we define the sources, targets, and values of our nodes which we have mapped from our table.
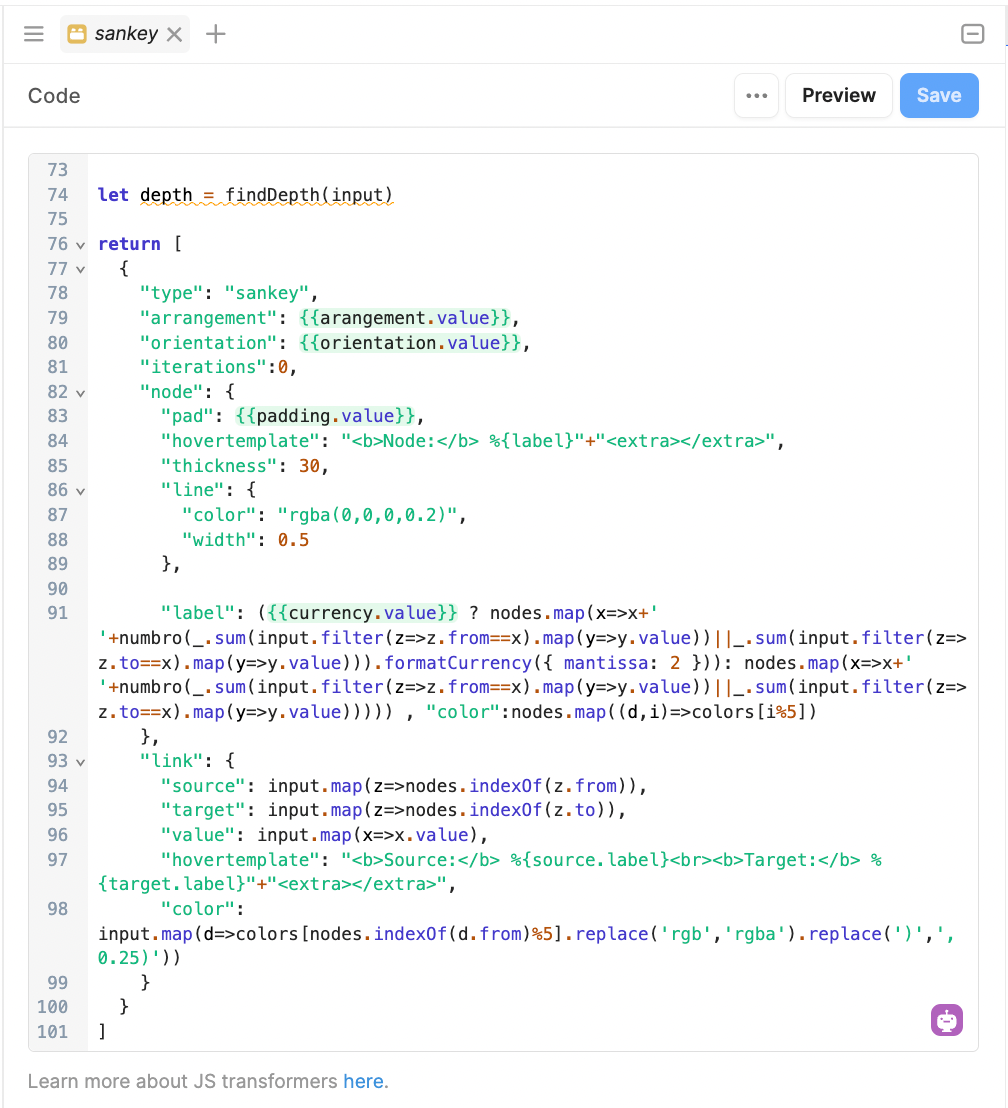
We’ll explain this code as we show you some more features.
User interface
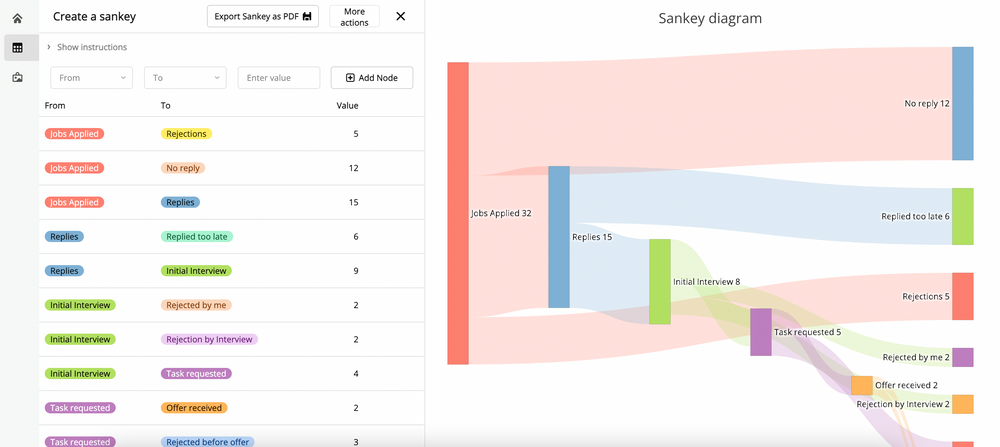
What’s most important about this app, is the ability for any user – whether familiar or unfamiliar with Sankey diagrams or code – to jump in and use it right away. That’s why we set the configuration interface up as a simple table.
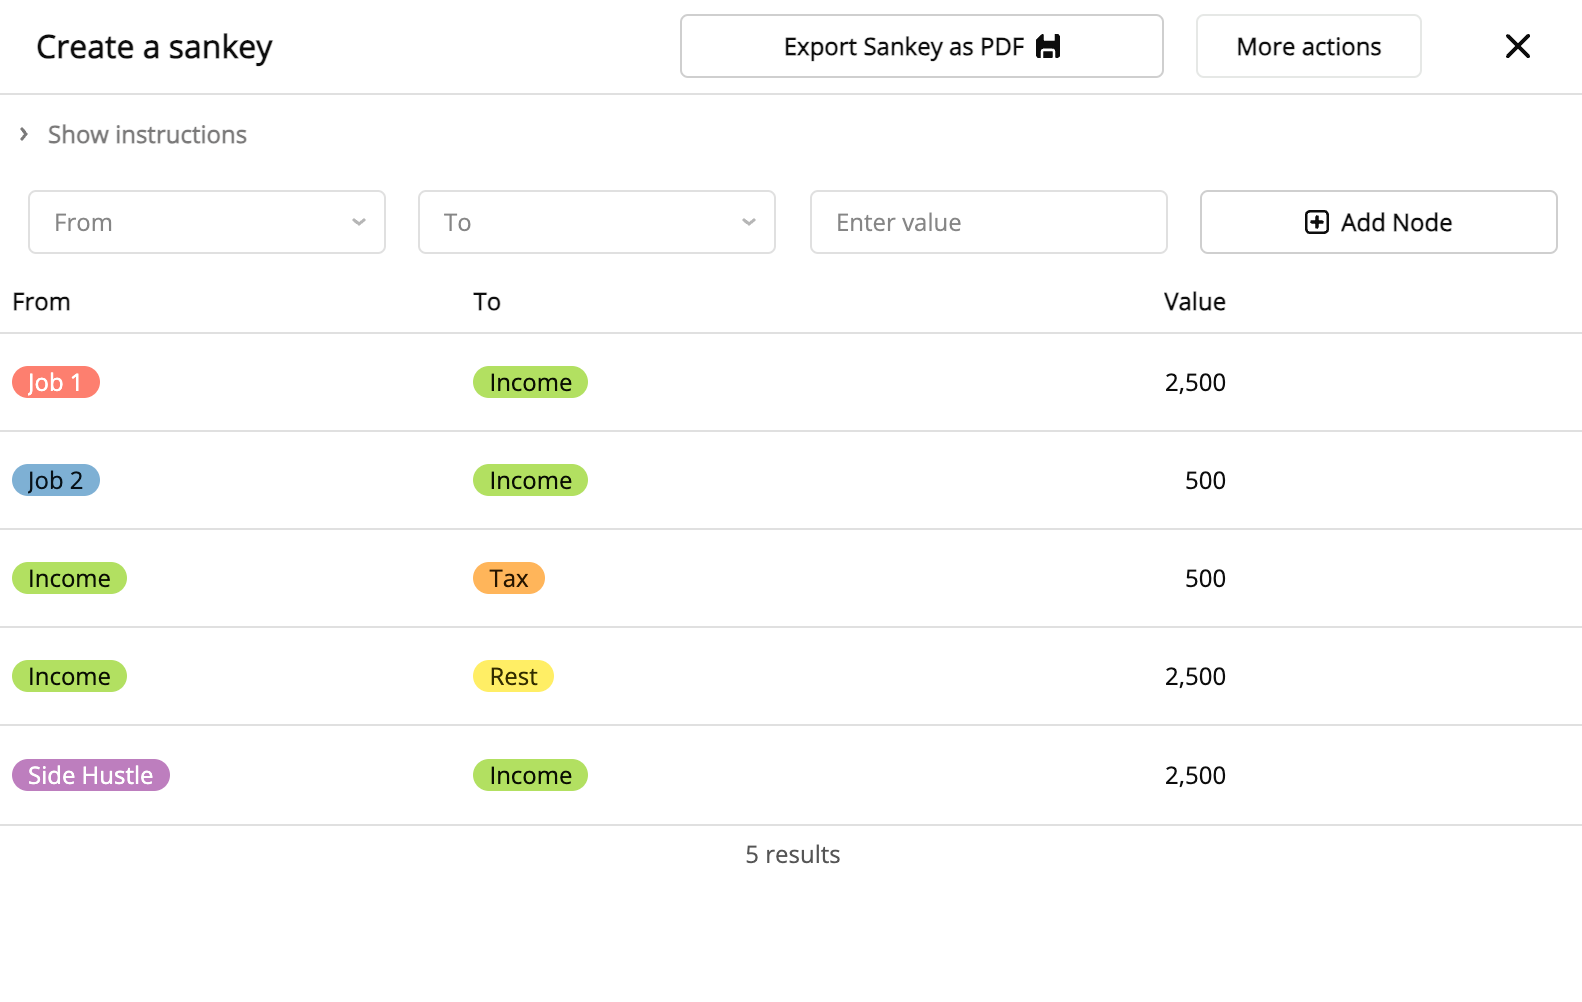
The table that is shown is based on the values in the ‘sankey_input.value’, which defaults to the values in the selected template. This value is how we create actions such as adding and deleting nodes.
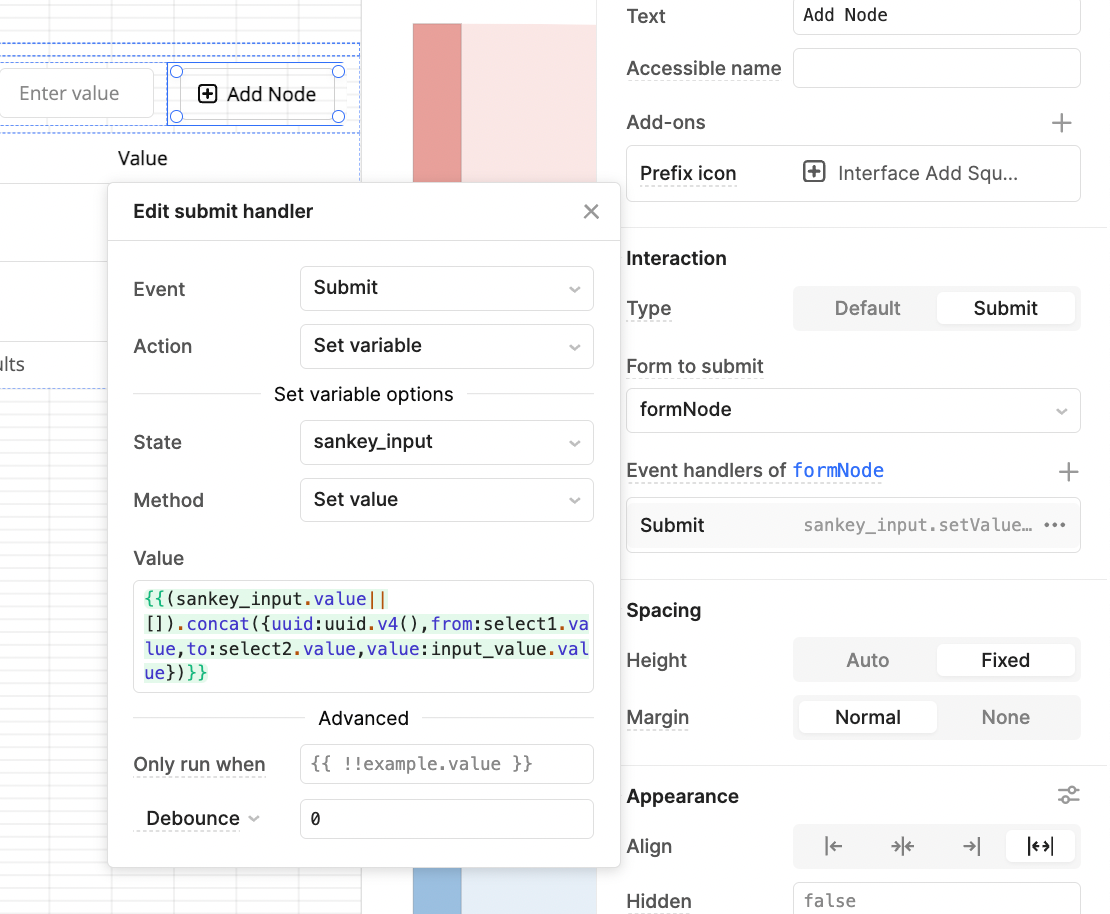
Users can add new nodes to this table and chart by selecting the from and to inputs and defining a value. The dropdown (select) components are defined by the values already in the table, but custom values are also allowed so that new sources and targets can be created.
When ‘Add node’ is clicked, the node is defined as a new value in the sankey_input variable and it will then appear in the table and Sankey diagram.
Users can delete a node by clicking the trash can in-line in the table. This is set as a row action in Retool.
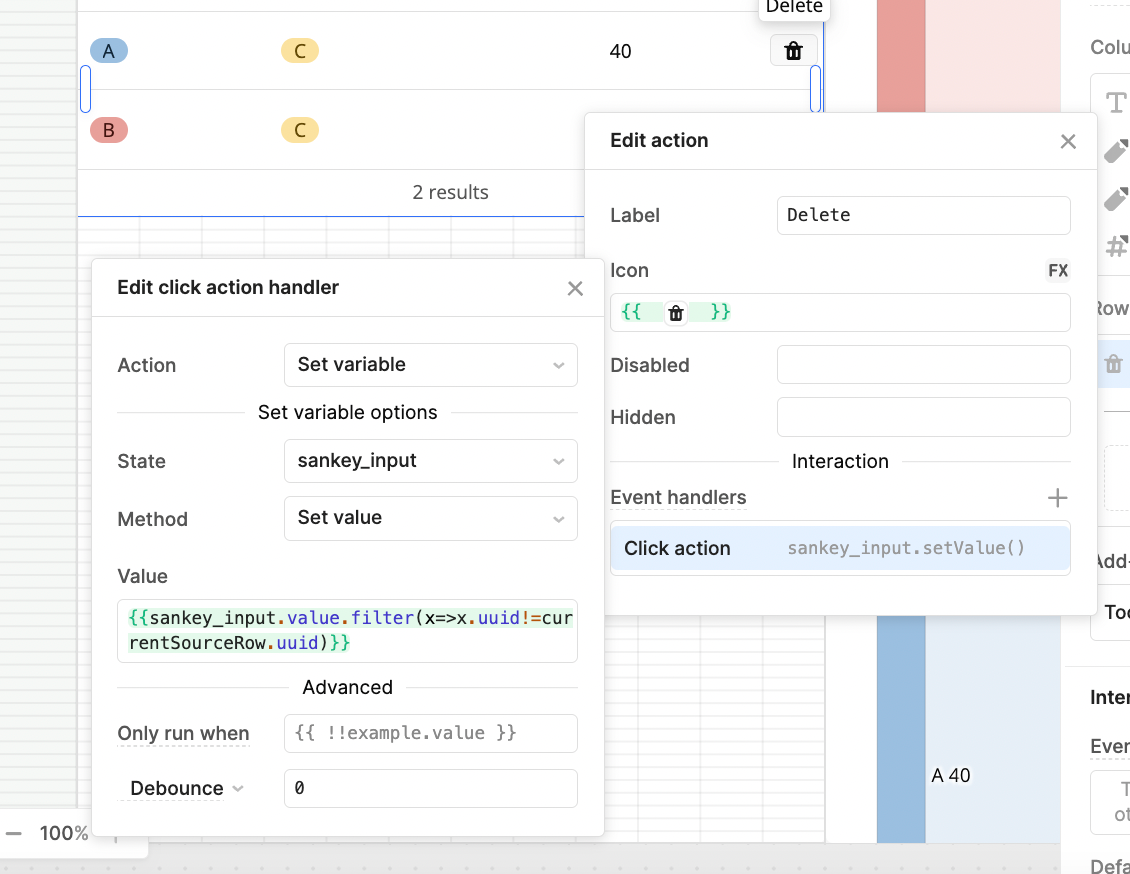
Hovering over a row pulls up a row action and clicking on this action will delete the entire row and all of its parts. Deleting a row will also reevaluate all target node values to account for the deleted node and readjust the proportions of the nodes.
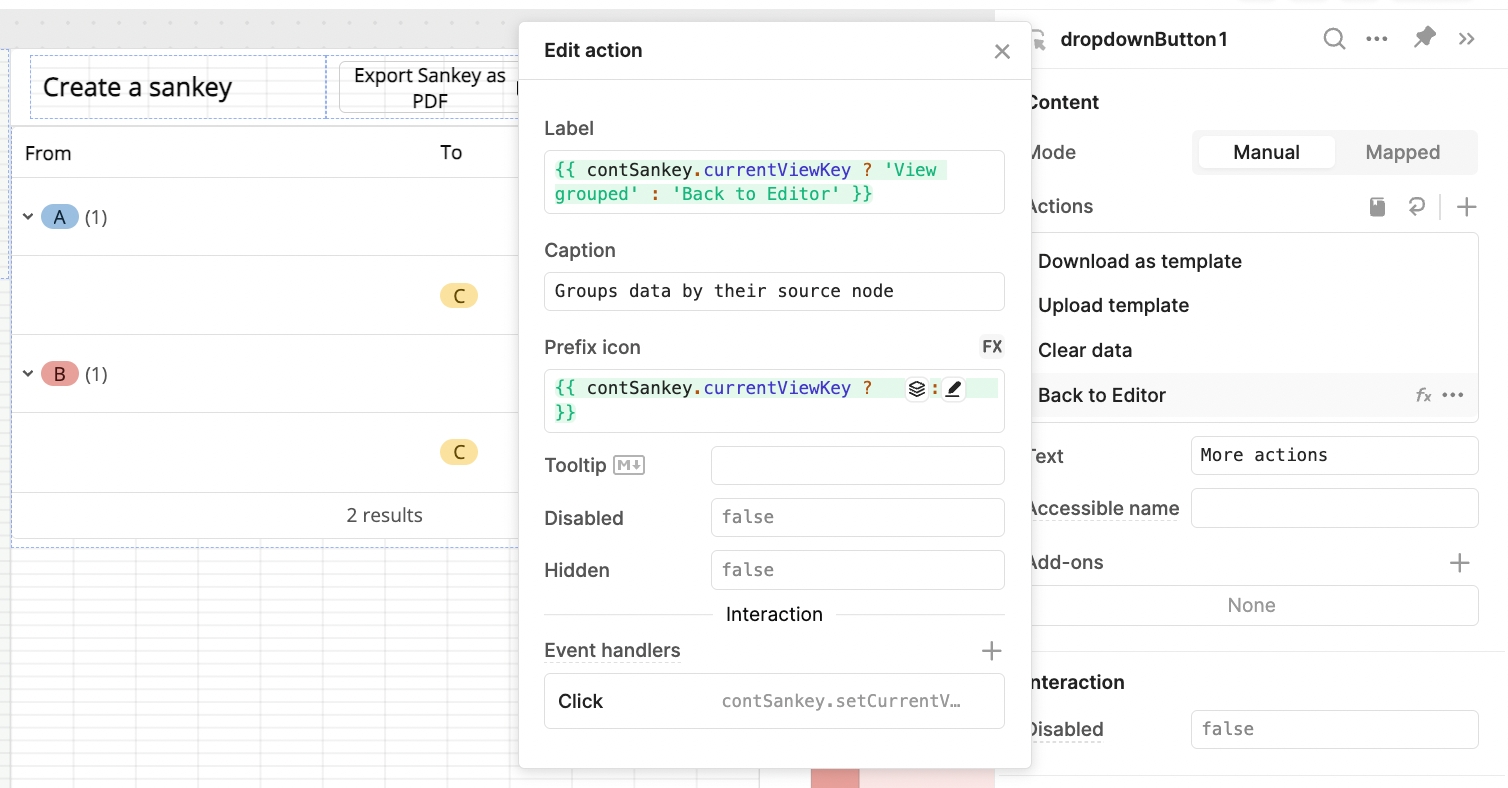
By clicking ‘More actions’ users can clear the entire table and start from scratch, and also view the table rows grouped by their source node to help them understand more complex tables. This simply switches a tabbed container to a different table view which is grouped by default.
Now let’s look at some more features that we built in to make this app more user-friendly.
Downloading the CSV template
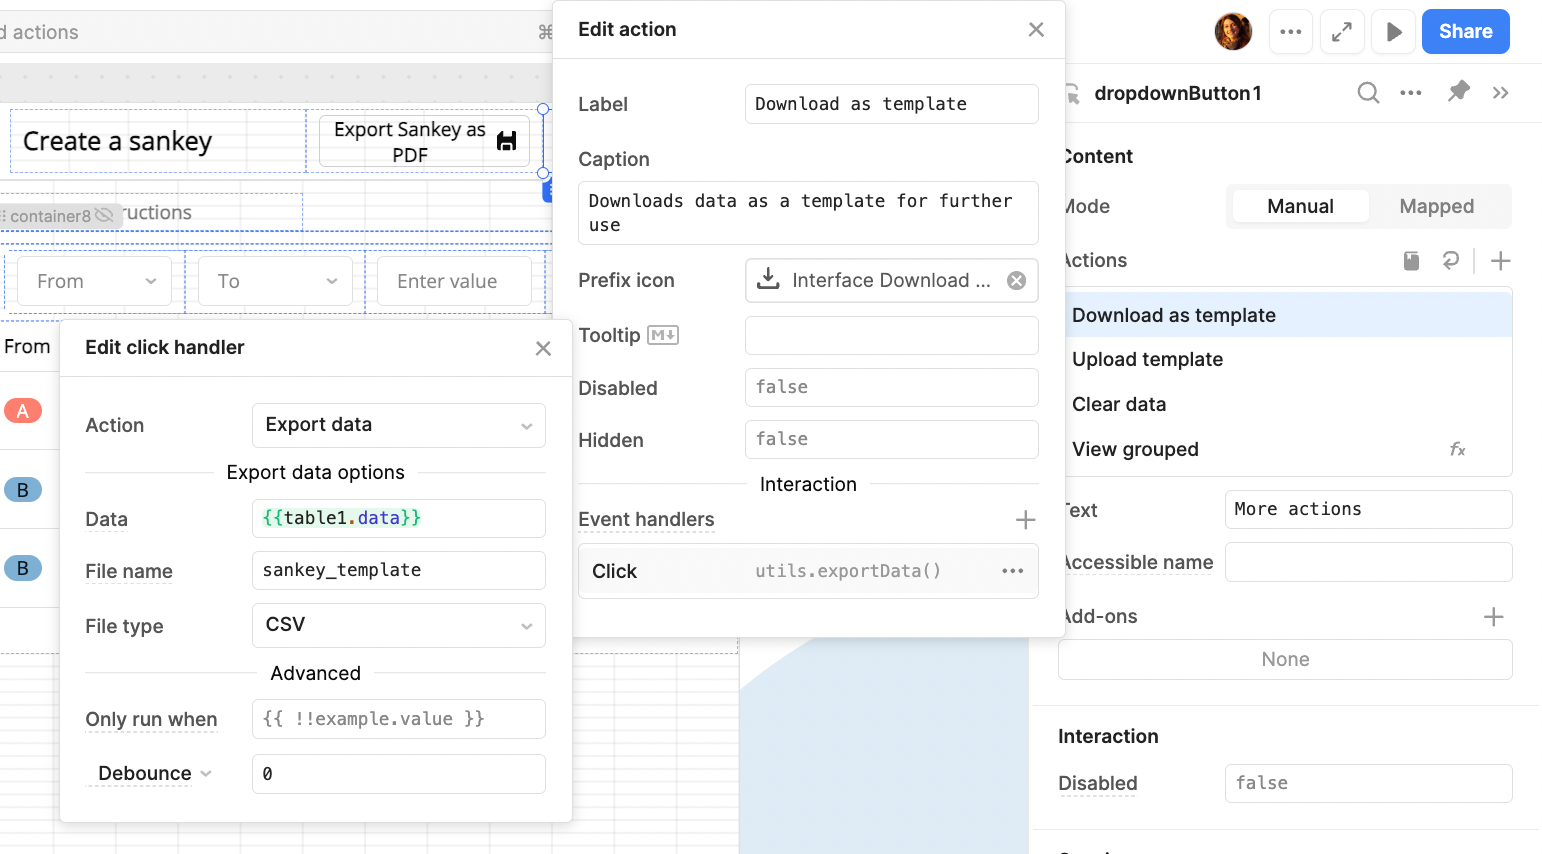
If a user doesn’t have the chance to complete their chart, or wants to save their Sankey to edit later, they can click ‘download as template’ in the top right hand corner.
Download as template will save the Sankey configuration as a simple CSV which can then be reimported.
To upload a template, users just click on ‘More actions’ once more and select Upload. This opens a modal with a file dropzone.
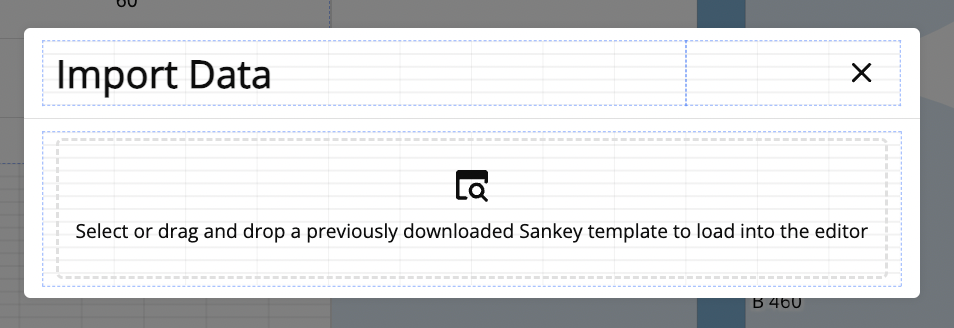
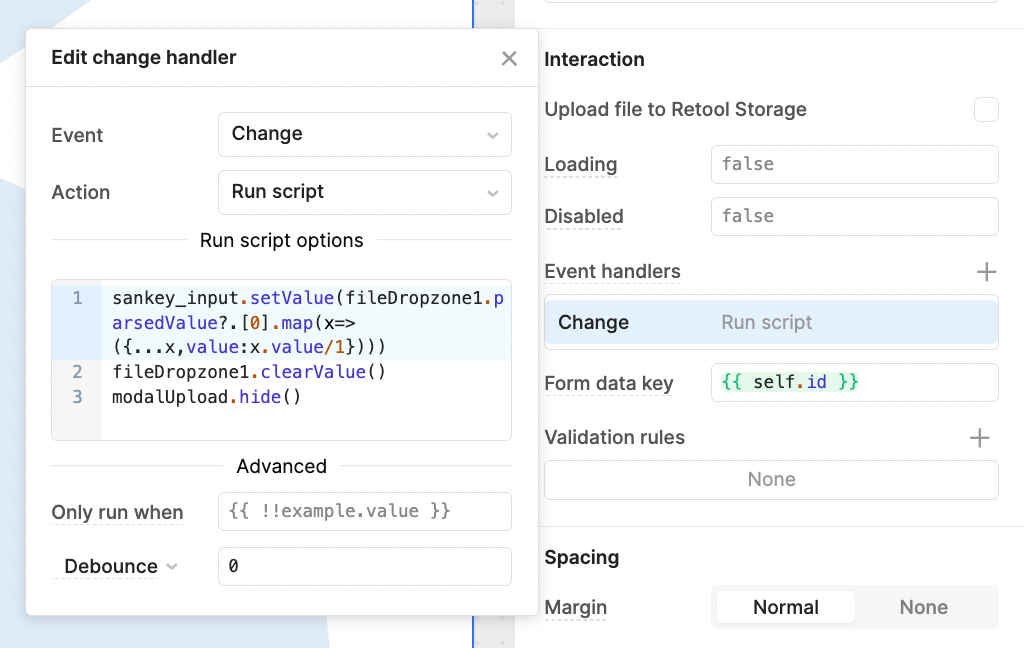
Once a user drops their CSV file template here, a script uses this to set the value of sankey_input once more, clear the dropzone and close the modal. Then the user will have the same Sankey chart in their app once more.
Exporting the Sankey to PDF
While users can take a screenshot of their Sankey chart, it can be really useful to have as a handy PDF. So, in the top corner of the configuration we added an ‘Export Sankey as PDF’ button. This uses the Retool utils.downloadPage option. You can learn more about PDFs in Retool in our PDF guide.
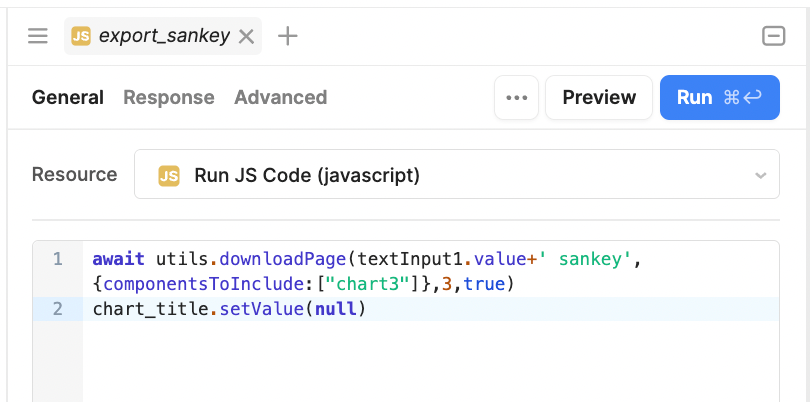
This will automatically download the chart to a single-page PDF and set the file title to the title of the Sankey.
Customizing the Sankey diagram
Finally, it’s obviously important to most people that their Sankey diagrams suit their personal style, so that’s why we added some detailed configuration options.
On the design tab of the application, you can set the title, the background color, font height and color theme for the actual diagram itself. The title text and font size is then set in the Layout object of the Plotly chart.
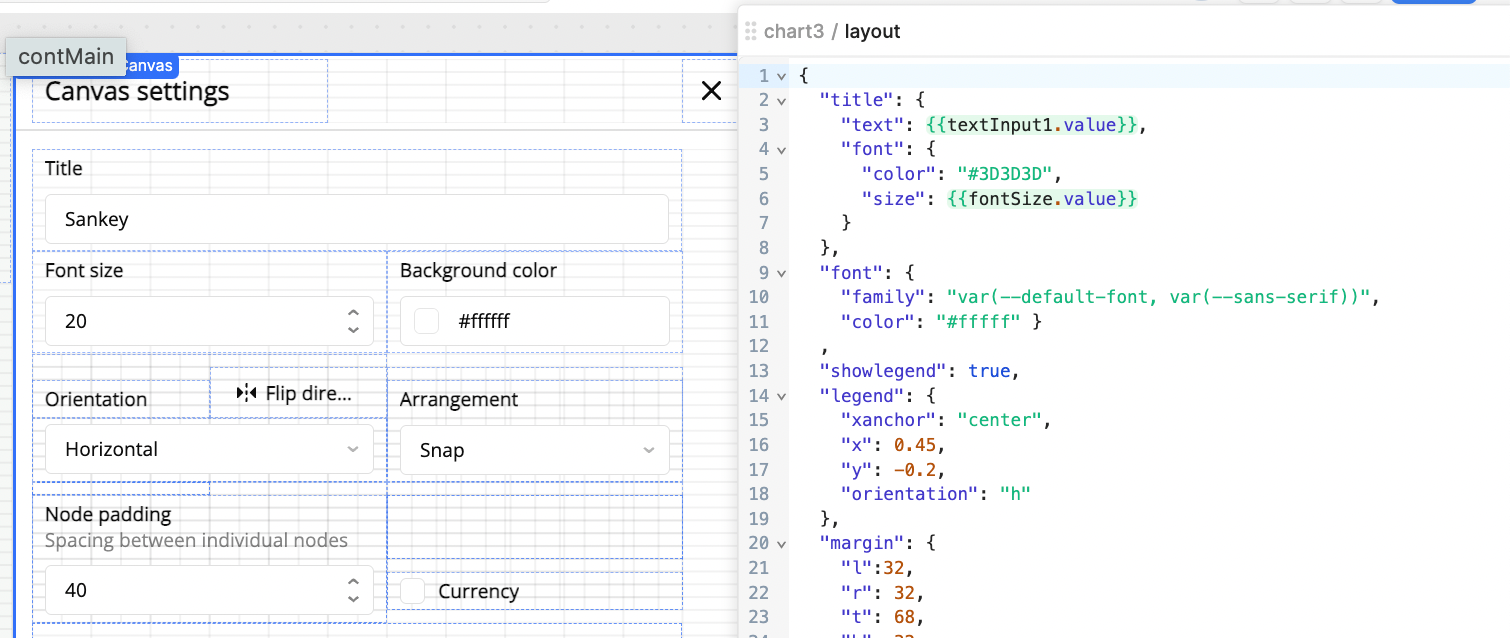
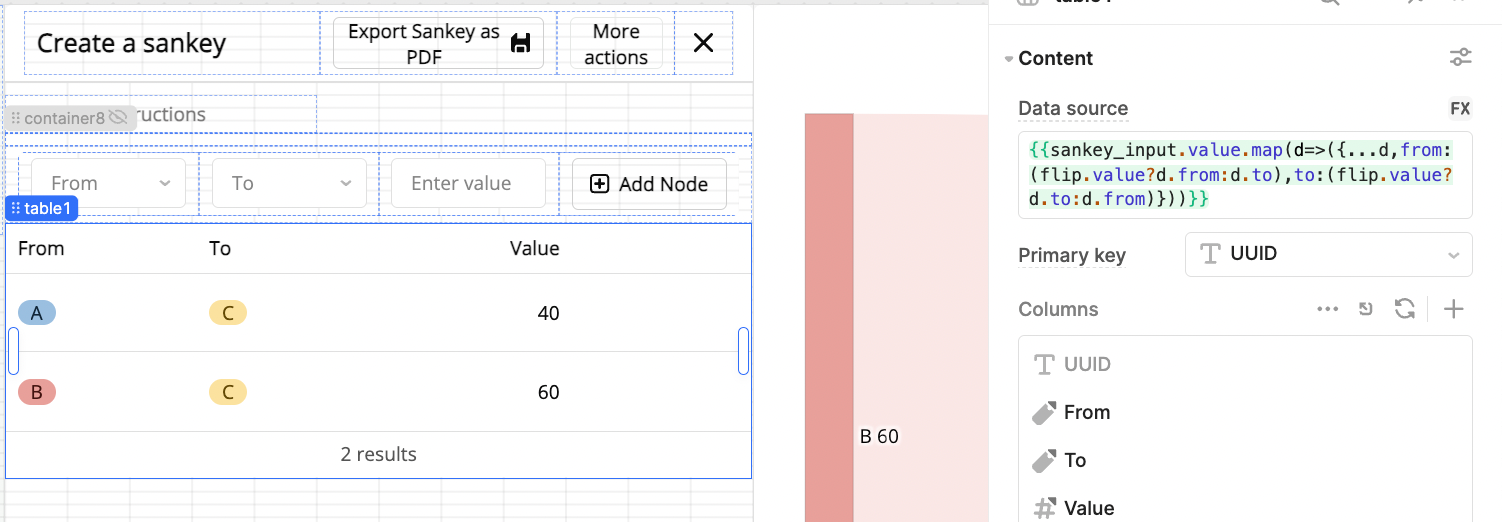
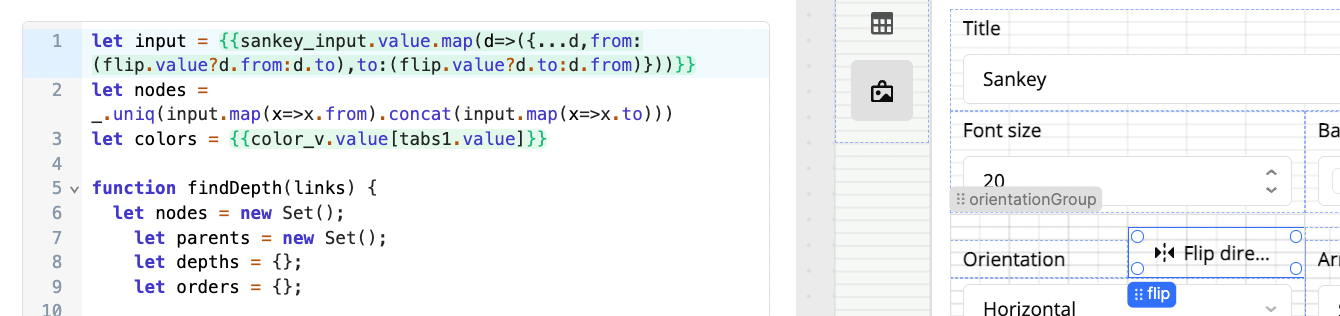
We also added options to change the orientation and flip the data. The orientation is a simple boolean value inside the Plotly docs (see our first code image) and the flip option simply inverts the data throughout.
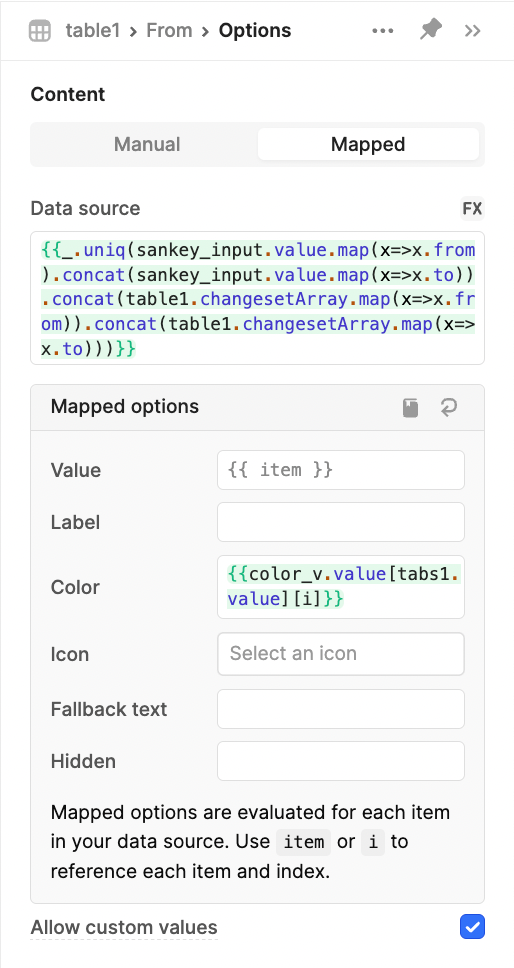
We set the color options using some color palettes. We start with three default palettes, which are defined in the color_v variable and presented in a Listview with a repeating color input component.
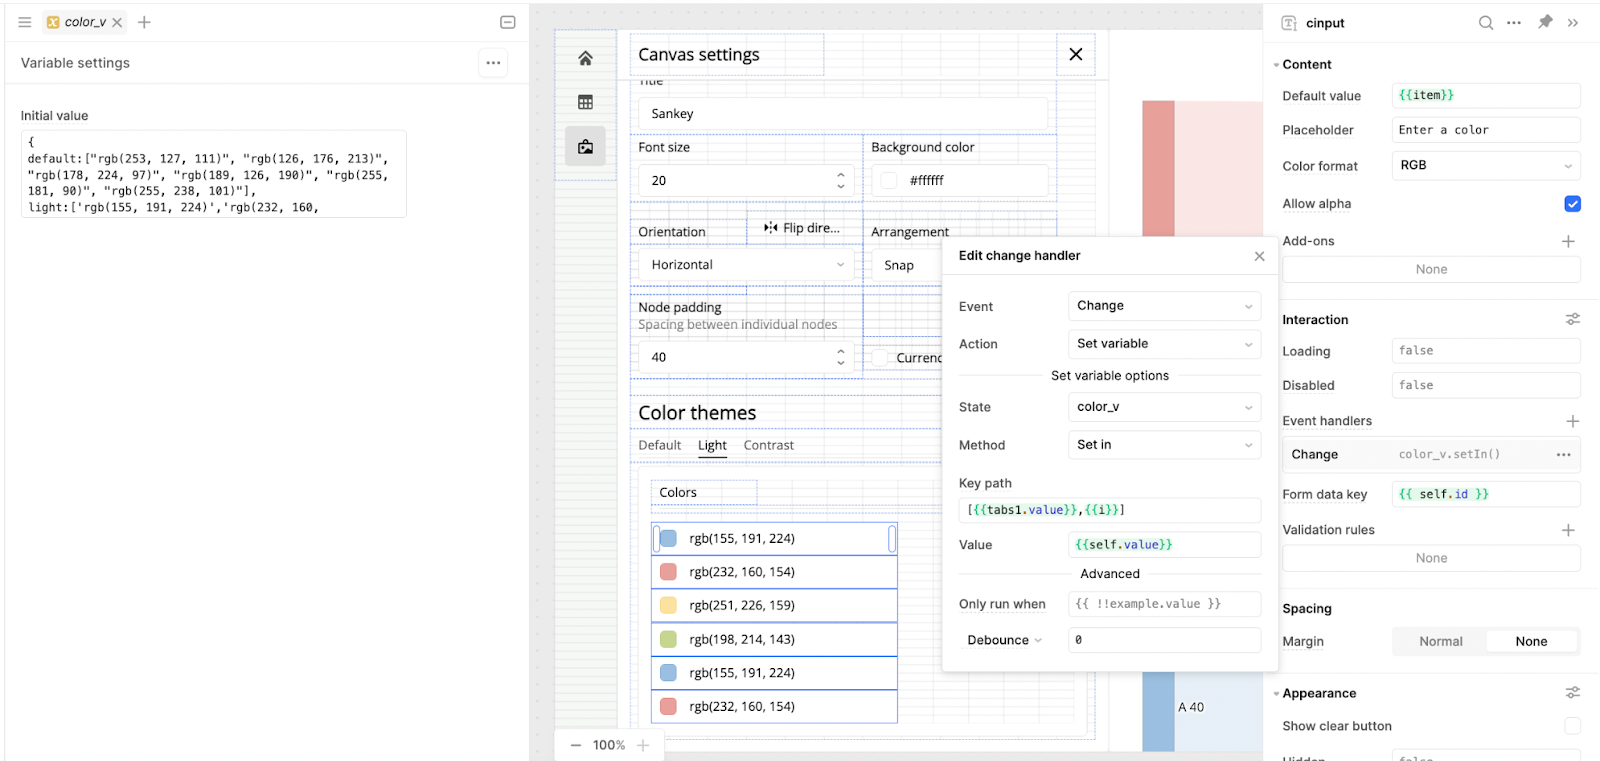
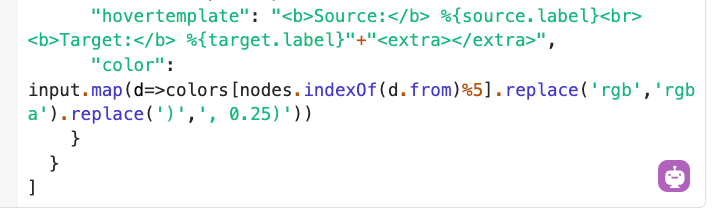
When a different color is selected from the color inputs, this sets the new value in the color_v variable. Finally, in our Sankey code, we defined the color variable as an array based on this variable called ‘color’ and, with a little tweaking, mapped this as the color options in the Sankey code.
Now, not only is it possible to build functional Sankey diagrams fast, they can be beautiful too!
While Retool is often seen as a product with limited charting options, we hope this proves the scope of what can be done with a little creativity in the Plotly code. Retool is a great platform for building intuitive, flexible UIs that can be quickly adjusted to user feedback and experience.
In the Part III of our Plotly series, we’ll be sharing some more unexpected charting options that you can include in Retool to make your internal apps (or even external ones) even more powerful.
Want to learn more about internal tools and how to build them? Check out our sections on low-code tools like Notion and Airtable, or developer tools like Retool and Windmill.

