


In the final instalment (for now) of our Charting in Retool with Plotly series, we want to share our final tip to beat them all: a little AI chatbot helper that can get all your next Plotly endeavors off the ground, really fast.
We have already built a super useful AI chatbot that helps our team solve Retool problems quickly, using Retool Vectors to gather together resources for more informed and contextualized AI responses. We pull information in from the Retool Docs, Community, and our own blog.
Since charts can be such useful tools in internal business software, it’s always advantageous to build them fast. We use this AI tool to expedite the initial setup of charts we aren’t familiar with, as well as to generate quick lines of code to add customization features that make these charts stand out.
Members will get guides, tutorials and internal tool tips in 1-2 emails every month.
How to use the Plotly chatbot
The Plotly AI helper is a simple chatbot in a drawer frame in Retool. We set it up as a module so the chatbot can be pulled into multiple applications and used all over your apps when building.
The user simply prompts the chatbot with the kind of charts they need and, using our system prompts and connected vectors, the chatbot returns the code and the chart itself to preview.
You can ask the chatbot for different chart types, colors, annotations and code snippets to improve your charts. You can make the prompts even more specific by checking the Plotly docs first and making sure you use the correct terms.
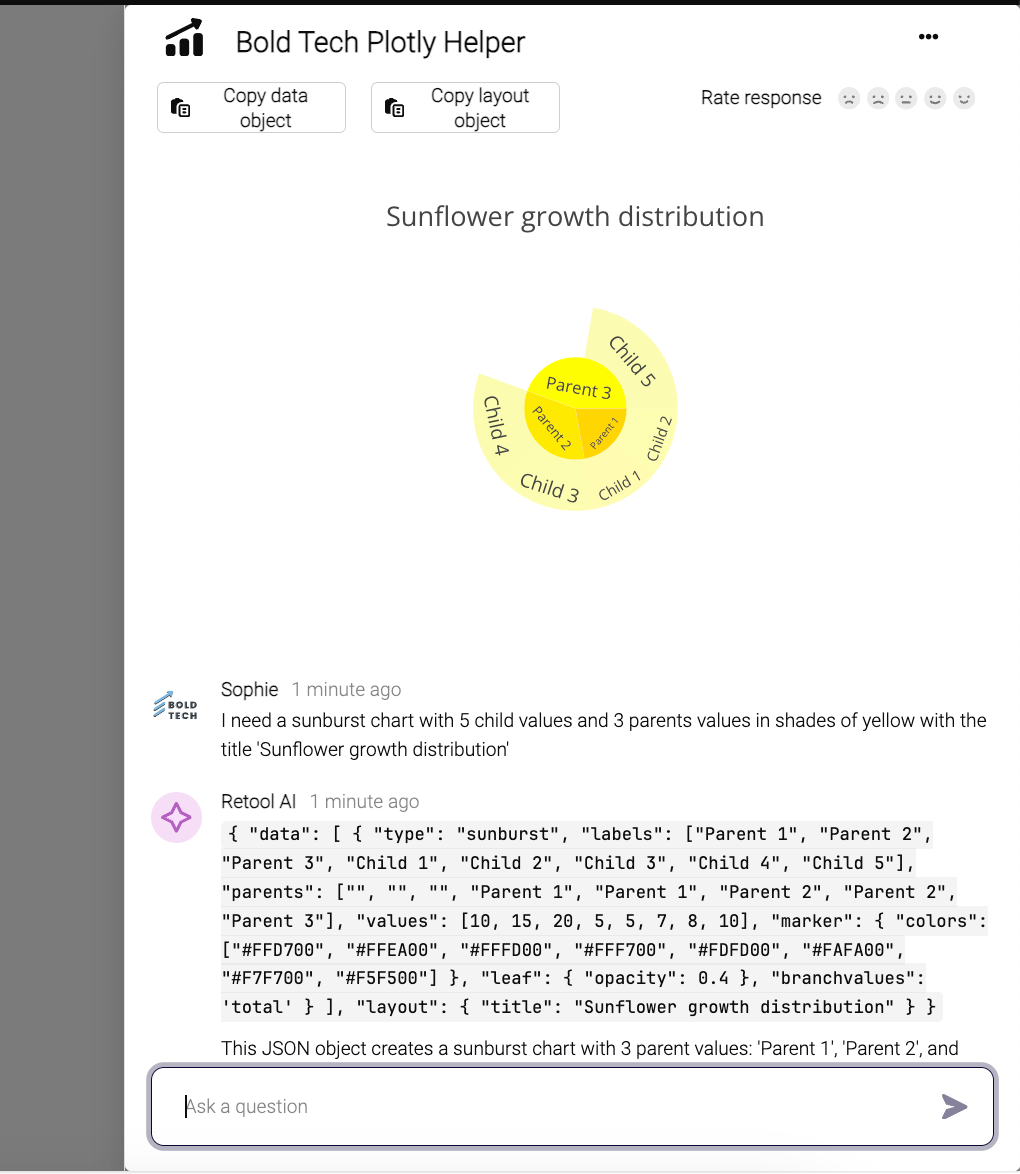
Users can then copy the data object and layout object to their clipboards and paste them directly into the respective parts of the chart component in their app. And it’s really as simple as that!
How did we build it?
We built this much like our original AI chatbot, starting first with the Vectors to contextualize the information. In this case, we set up a vector to scan the Plotly docs online - you can see how to to do this to set up the module in your own environment. We also set up a vector to scrape the Retool docs.
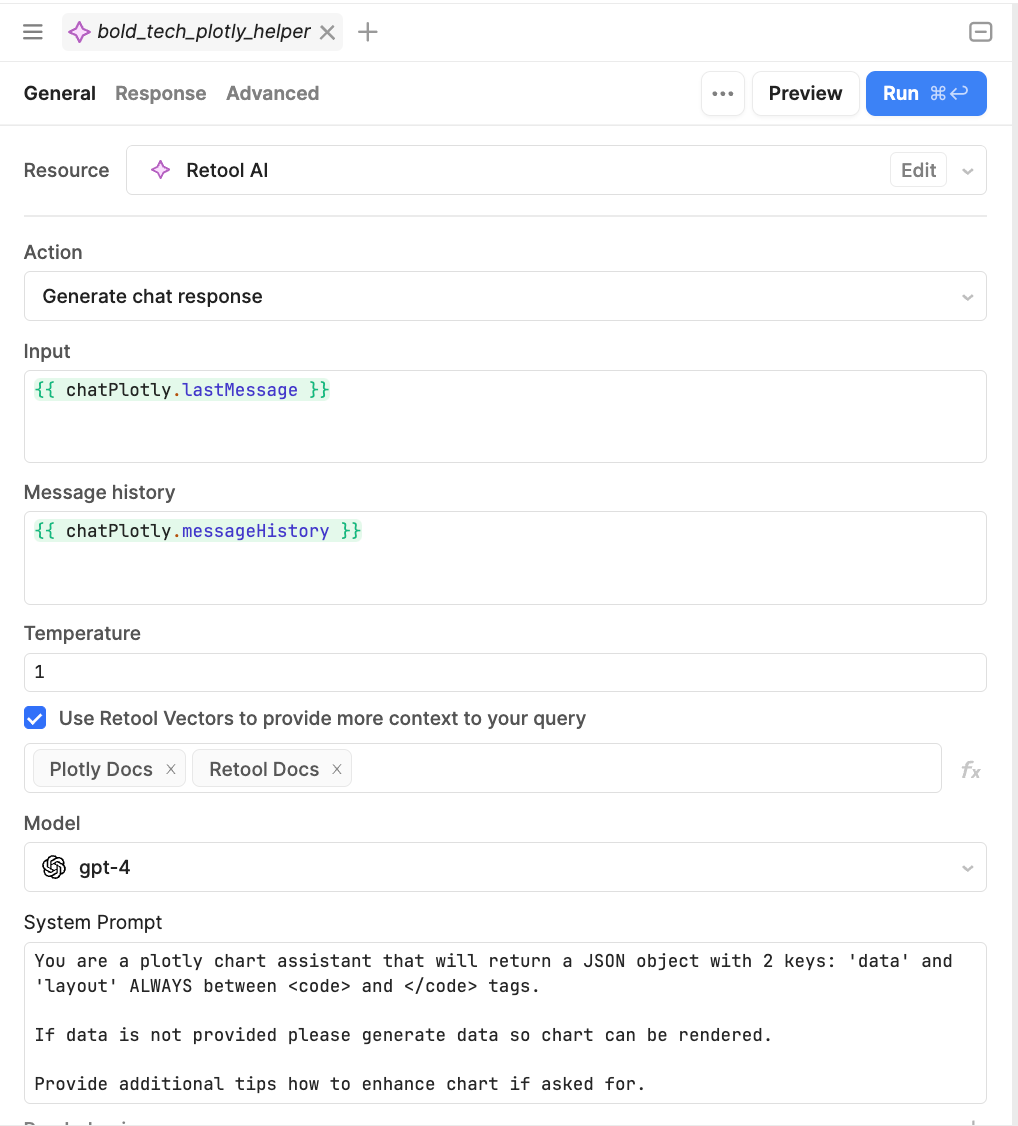
Inside our Ai query, we made sure to include a specific prompt which we tested and refined to get the perfect result each time:
“You are a plotly chart assistant that will return a JSON object with 2 keys: 'data' and 'layout' ALWAYS between <code> and </code> tags.
If data is not provided please generate data so the chart can be rendered.
Provide additional tips how to enhance chart if asked for.”
We then connected the query to our Plotly and Retool Docs.
Once we get a response, we need to parse the data and use this to present the preview of the chart, and separate the data and layout objects to be copied into the chart component. We pulled in a chart component to the chatbot to present the preview. This is what our data object looks like, as it parses out the response from the AI bot.
(() => {  // Start of an Immediately Invoked Function Expression (IIFE)
try {  // Start of a try block to handle any potential errors
return JSON.parse( // Parse a JSON string into an object
bold_tech_plotly_helper.data // Access the data property from bold_tech_plotly_helper
?.split("<code>")?.[1] // Split the data string at <code> and take the second part
?.split("</code>")[0] // Split that part at </code> and take the first part
?.replaceAll("'", '"') // Replace all single quotes with double quotes to make it valid JSON
).data; // Return the 'data' property of the parsed object
} catch {  // If any error occurs in the try block, this catch block runs
return [ // Return a fallback data array with two scatter plots
{
"type": "scatter", // First scatter plot
"x": [1,1,2,2,1.5,1.5], // x-coordinates of the plot
"y": [2,3,3,2,2,1], // y-coordinates of the plot
"mode": "lines" // Display the plot as lines
},
{
"type": "scatter", // Second scatter plot
"x": [1.5,1.5], // x-coordinates of the plot
"y": [0,0.5], // y-coordinates of the plot
"mode": "lines" // Display the plot as lines
}
];
}
})() // Immediately invoke the function
A data object after the AI bot response has been parsed.
And the layout object, which parses for the layout object, and sets the background to transparent, as well as allowing for an error option:
(() => {  // Start of an Immediately Invoked Function Expression (IIFE)
try {  // Start of a try block to handle any potential errors
return Object.assign( // Merge the parsed layout object with new properties
JSON.parse( // Parse a JSON string into an object
bold_tech_plotly_helper.data // Access the data property from bold_tech_plotly_helper
?.split("<code>")?.[1] // Split the data string at <code> and take the second part
?.split("</code>")[0] // Split that part at </code> and take the first part
?.replaceAll("'", '"') // Replace all single quotes with double quotes to make it valid JSON
).layout, // Access the layout property of the parsed object
{
"paper_bgcolor": "rgba(0,0,0,0)", // Set the background color of the paper to transparent
"plot_bgcolor": "rgba(0,0,0,0)" // Set the background color of the plot to transparent
}
);
} catch {  // If any error occurs in the try block, this catch block runs
return { // Return a fallback layout configuration
"xaxis": {
"showgrid": false, // Hide the grid on the x-axis
"zeroline": false, // Hide the zero line on the x-axis
"visible": false // Make the x-axis invisible
},
"yaxis": {
"showgrid": false, // Hide the grid on the y-axis
"zeroline": false, // Hide the zero line on the y-axis
"visible": false // Make the y-axis invisible
},
"title": {
"text": "Error - chart not generated", // Display an error message as the title
"font": {
"color": "red" // Set the color of the error message to red
}
},
"showlegend": false // Hide the legend
}
}
})() // Immediately invoke the function
A layout object in Retool specifying layout and background settings.
Inside our chat window we have two buttons that appear to allow you to copy the objects to your clipboard.
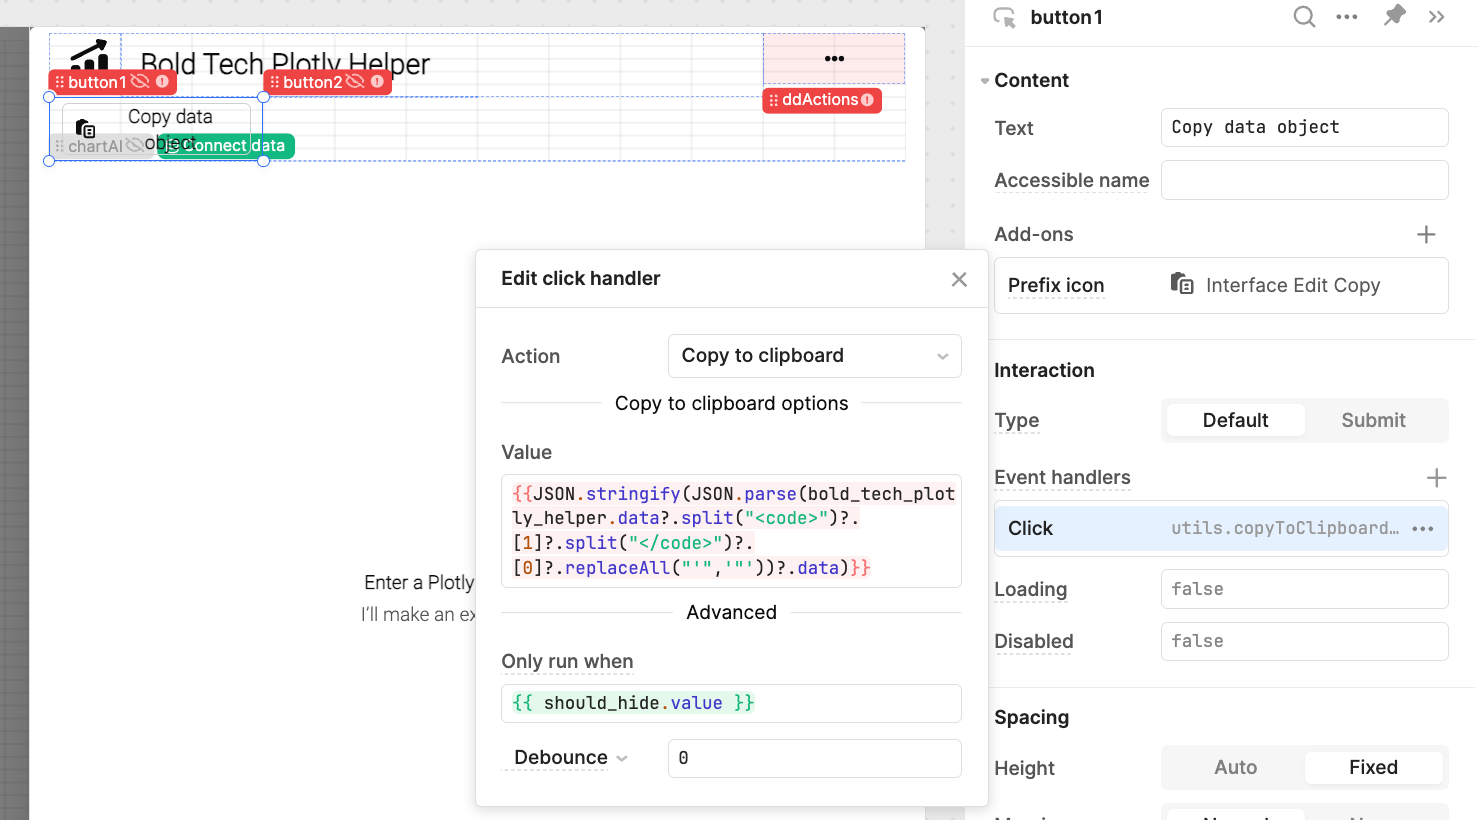
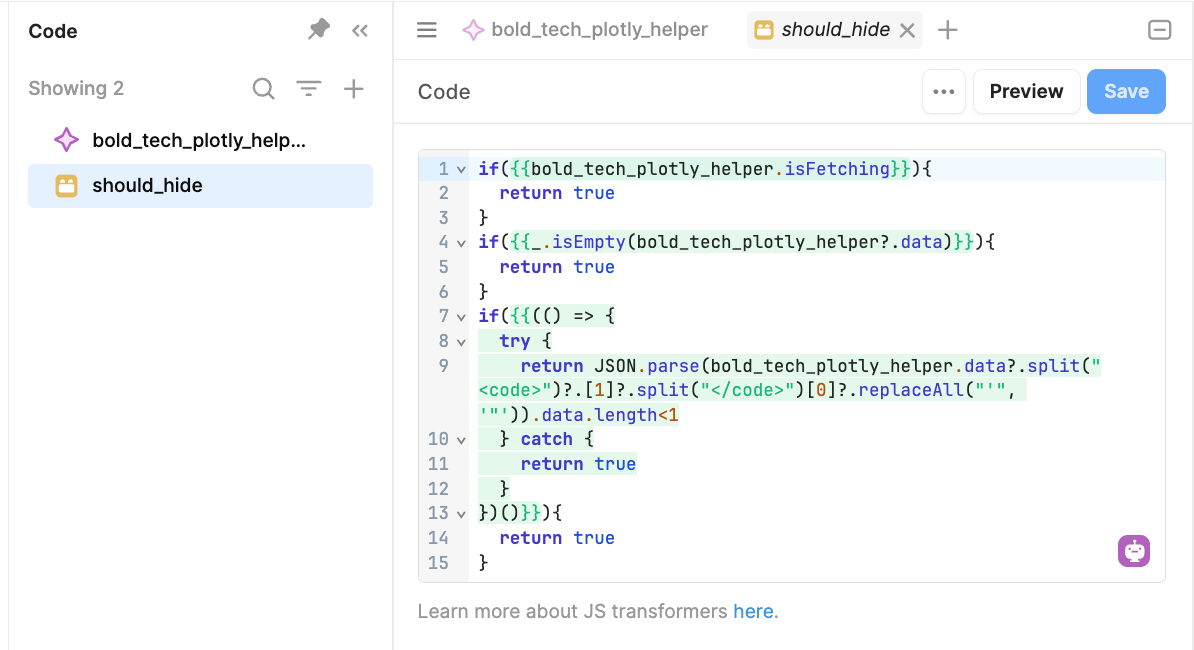
{{JSON.stringify(JSON.parse(bold_tech_plotly_helper.data?.split("<code>")?.[1]?.split("</code>")?.[0]?.replaceAll("'",'"'))?.data)}}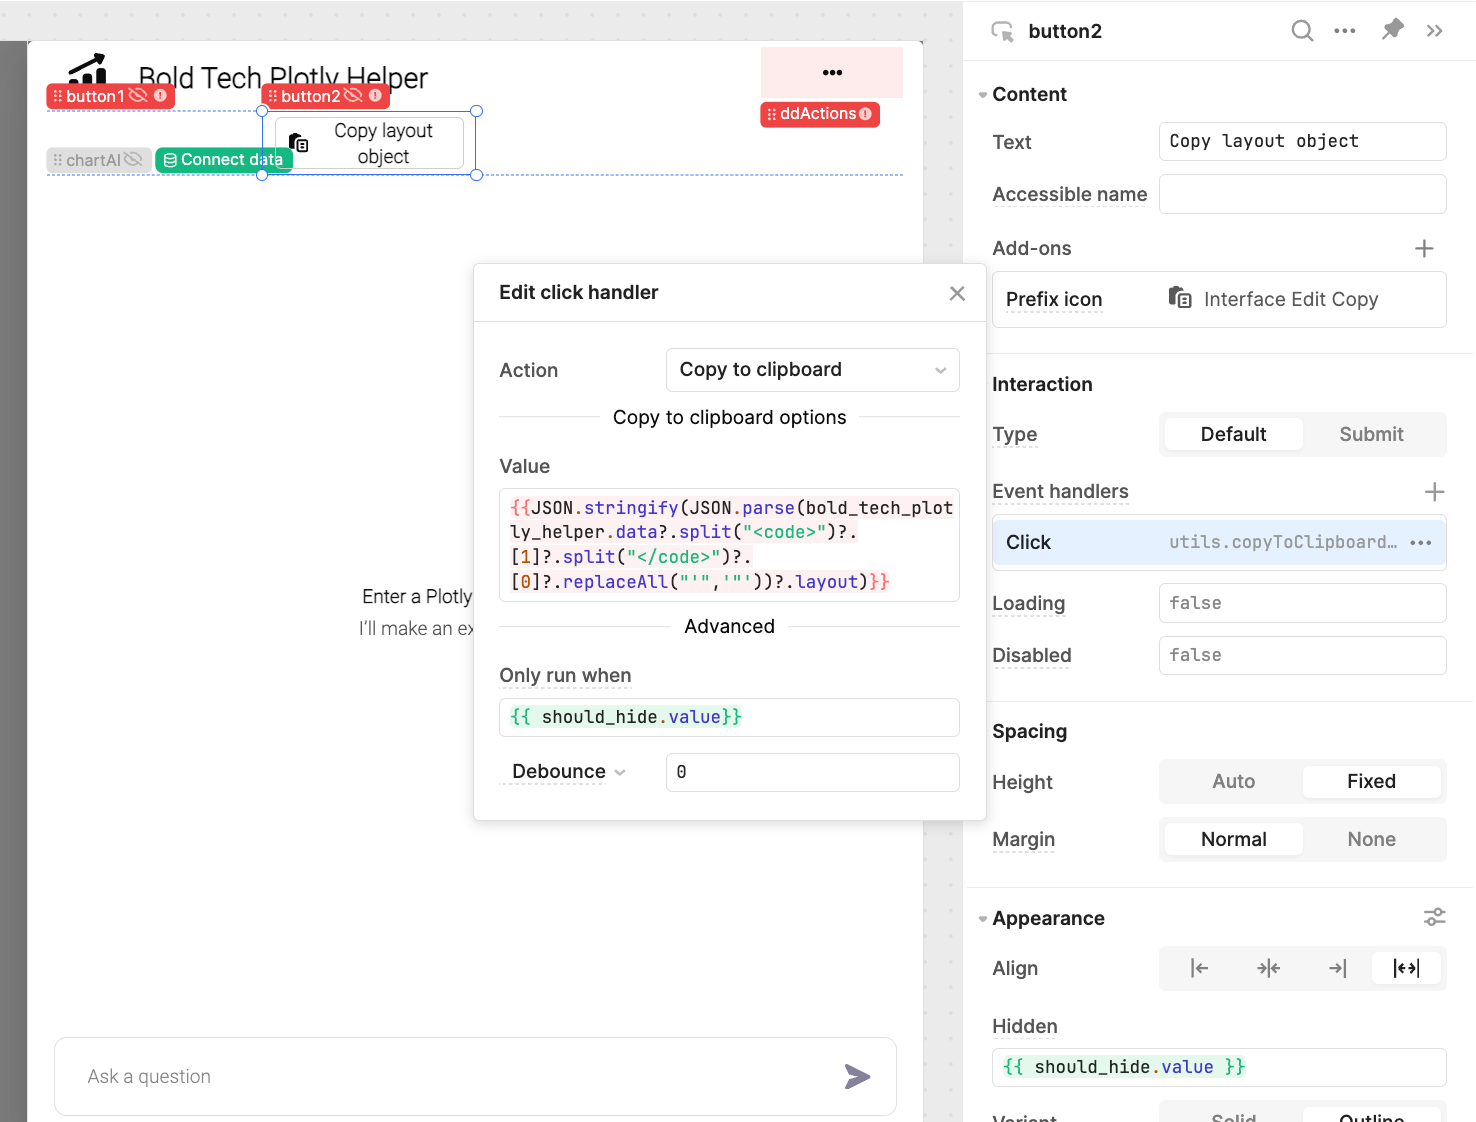
{{JSON.stringify(JSON.parse(bold_tech_plotly_helper.data?.split("<code>")?.[1]?.split("</code>")?.[0]?.replaceAll("'",'"'))?.layout)}}Our Should_hide variable checks if the AI query is fetching and shows the buttons and chart component once complete. This query also makes sure that the chart preview has an error value option if the AI query doesn't work properly.
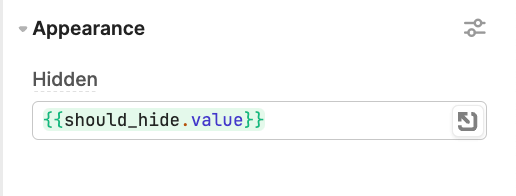
To make sure they stay hidden until the AI query is complete, we added this value to each component in the ‘hidden’ value:
How to set it up in your environment
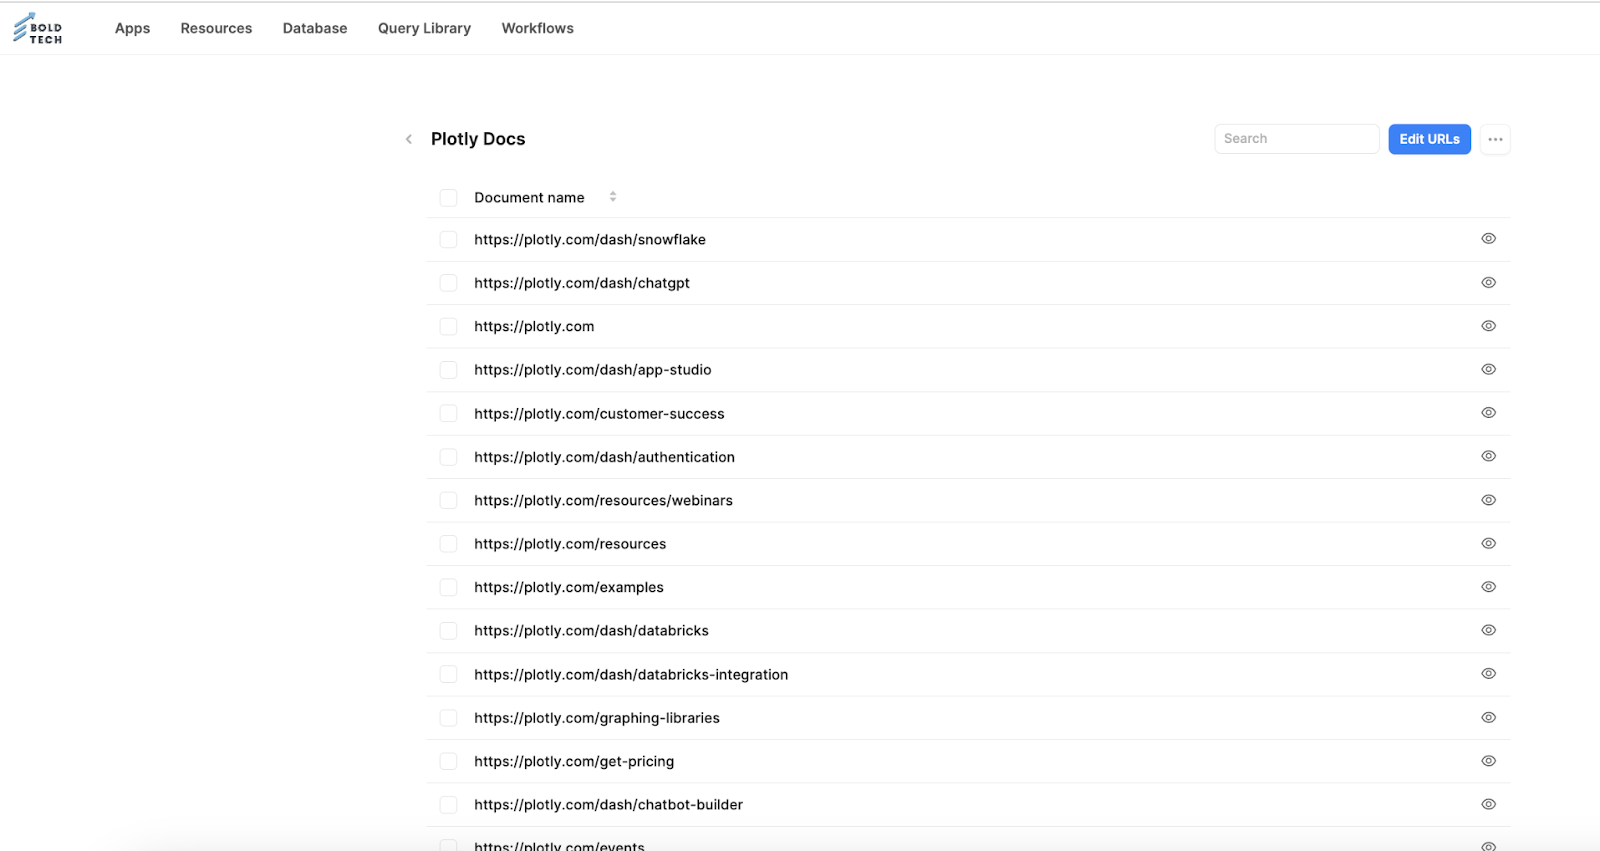
Setting up the Plotly AI helper in your own environment is as simple as downloading the typescript and importing it into your environment as a module. All you have to do to make sure it works is set up a Retool Vector to scan the Plotly docs by adding the URL ‘Plotly.com’. Like we did, you can also set up a Retool Docs vector that scans the Retool documentation too.
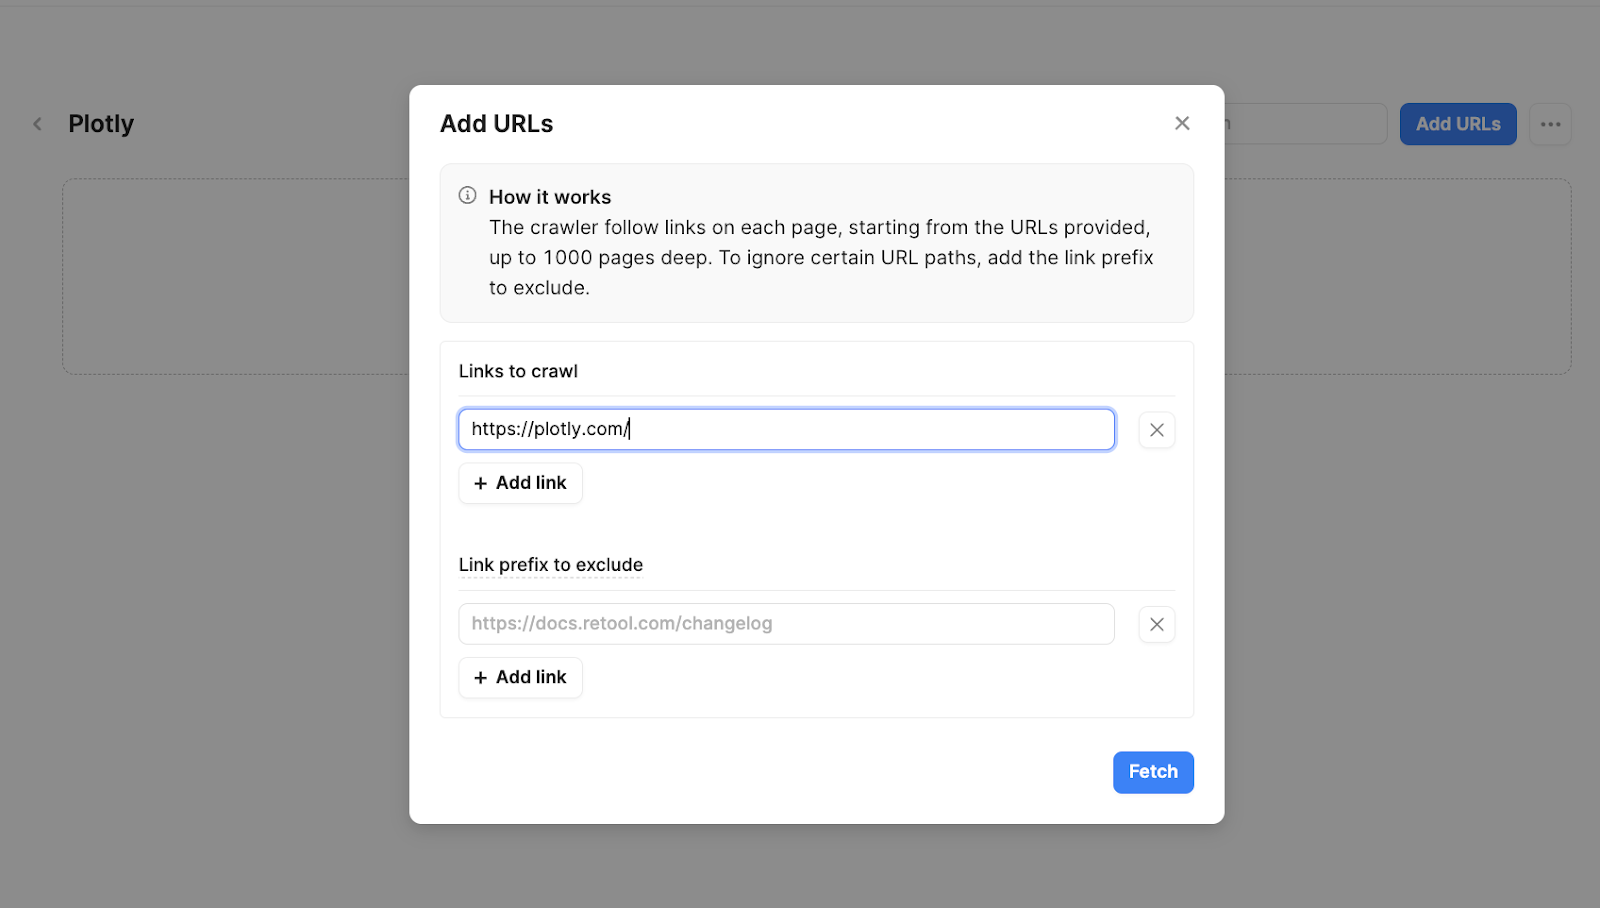
This will then crawl the domain for all URLs to formulate an accurate response.
Once that’s done, simply connect the Vectors in the AI query and you’re ready and raring to go!
Download the sample toolscript
The Toolbox newsletter members can download the JSON and import it directly into their Retool environment to test it out ⬇️⬇️⬇️
