


If you’re looking for a fast and scalable option for getting your business software up and running, Supabase is a great database to consider. Built on PostgreSQL, it has all the benefits of a simple, sturdy relational database you can query with SQL, with the addition of a sleek, intuitive UI to interact with your data. Supabase allows you to import your data and get started within minutes and is suitable for both non-developers and engineers alike.
In the first part of this 2-part tutorial, we\'ll use Supabase as a backend solution for a purchase order management dashboard, and in the second part, we\'ll add an inventory manager app to our system. To build the frontend we’ll be using Retool, a faster way to build internal business software.
This tutorial is simple enough for even non-developers to follow and should take less than 2 hours to complete.
Supabase is a great starting point for a database that you’d like to migrate from a spreadsheet-style storage system to something more technical, without too much engineering complexity. Using a SQL database instead of a spreadsheet is a much more efficient way to work with internal data, and ensures better data processing, validation, and the ability to scale.
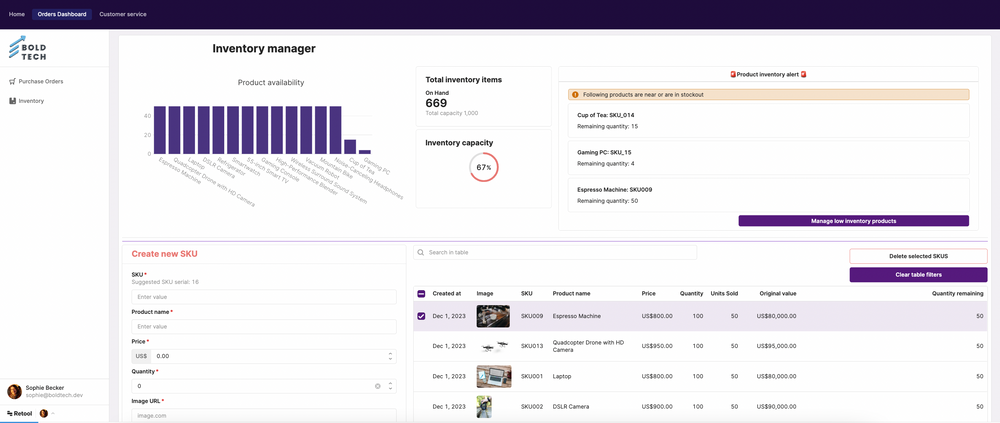
Here’s a sneak peek of our final app:
An order management system built in Retool using Supabase.
If you’re looking for more information on Supabase or Retool, you can learn more in our ‘What is…’ series where we do a deep dive on each platform.
Setting up your Supabase instance
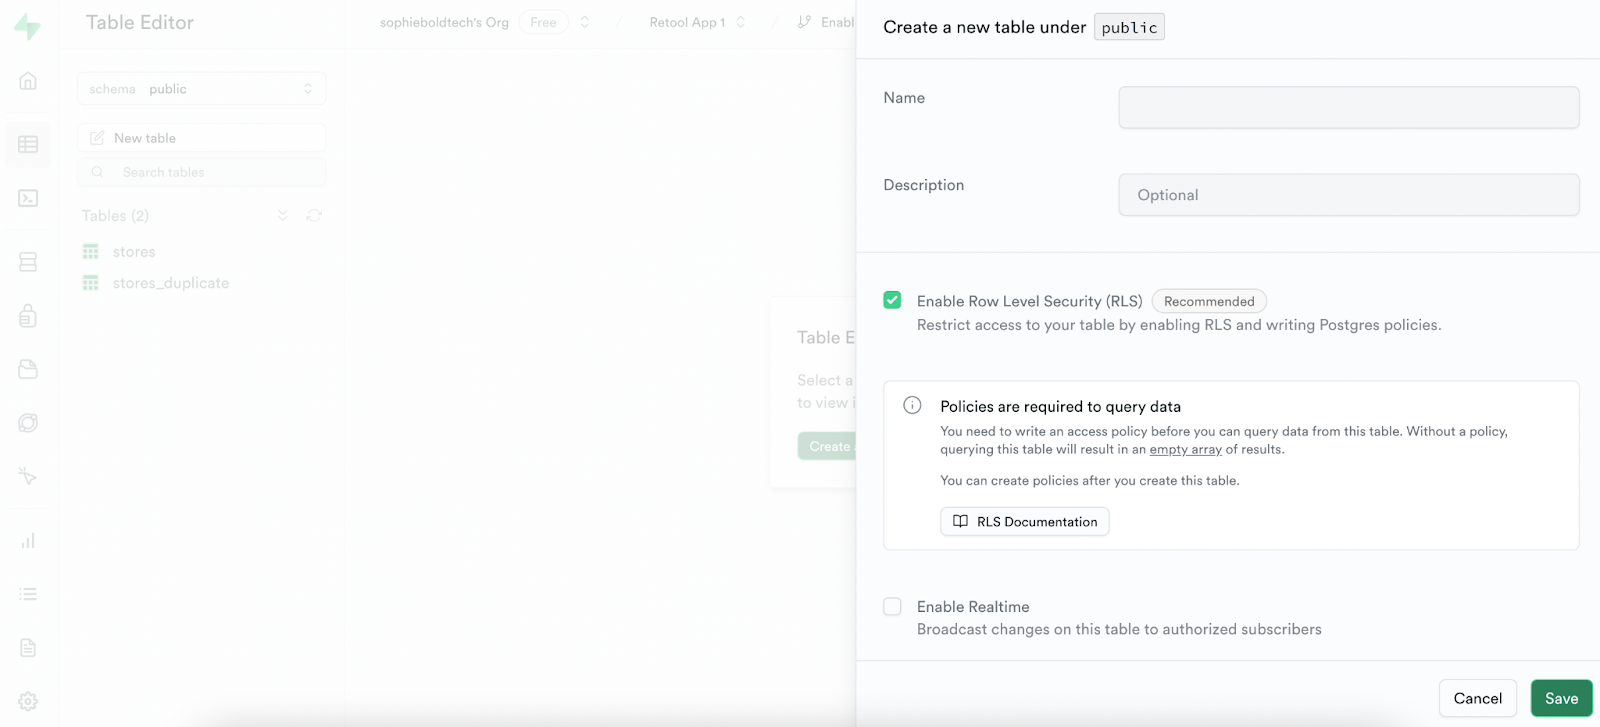
To get started, you’ll need to set up an account with Supabase. Once logged in, you can set up a project and add some tables for your data.
From here, you can easily configure the table settings and import your data via CSV or spreadsheet.
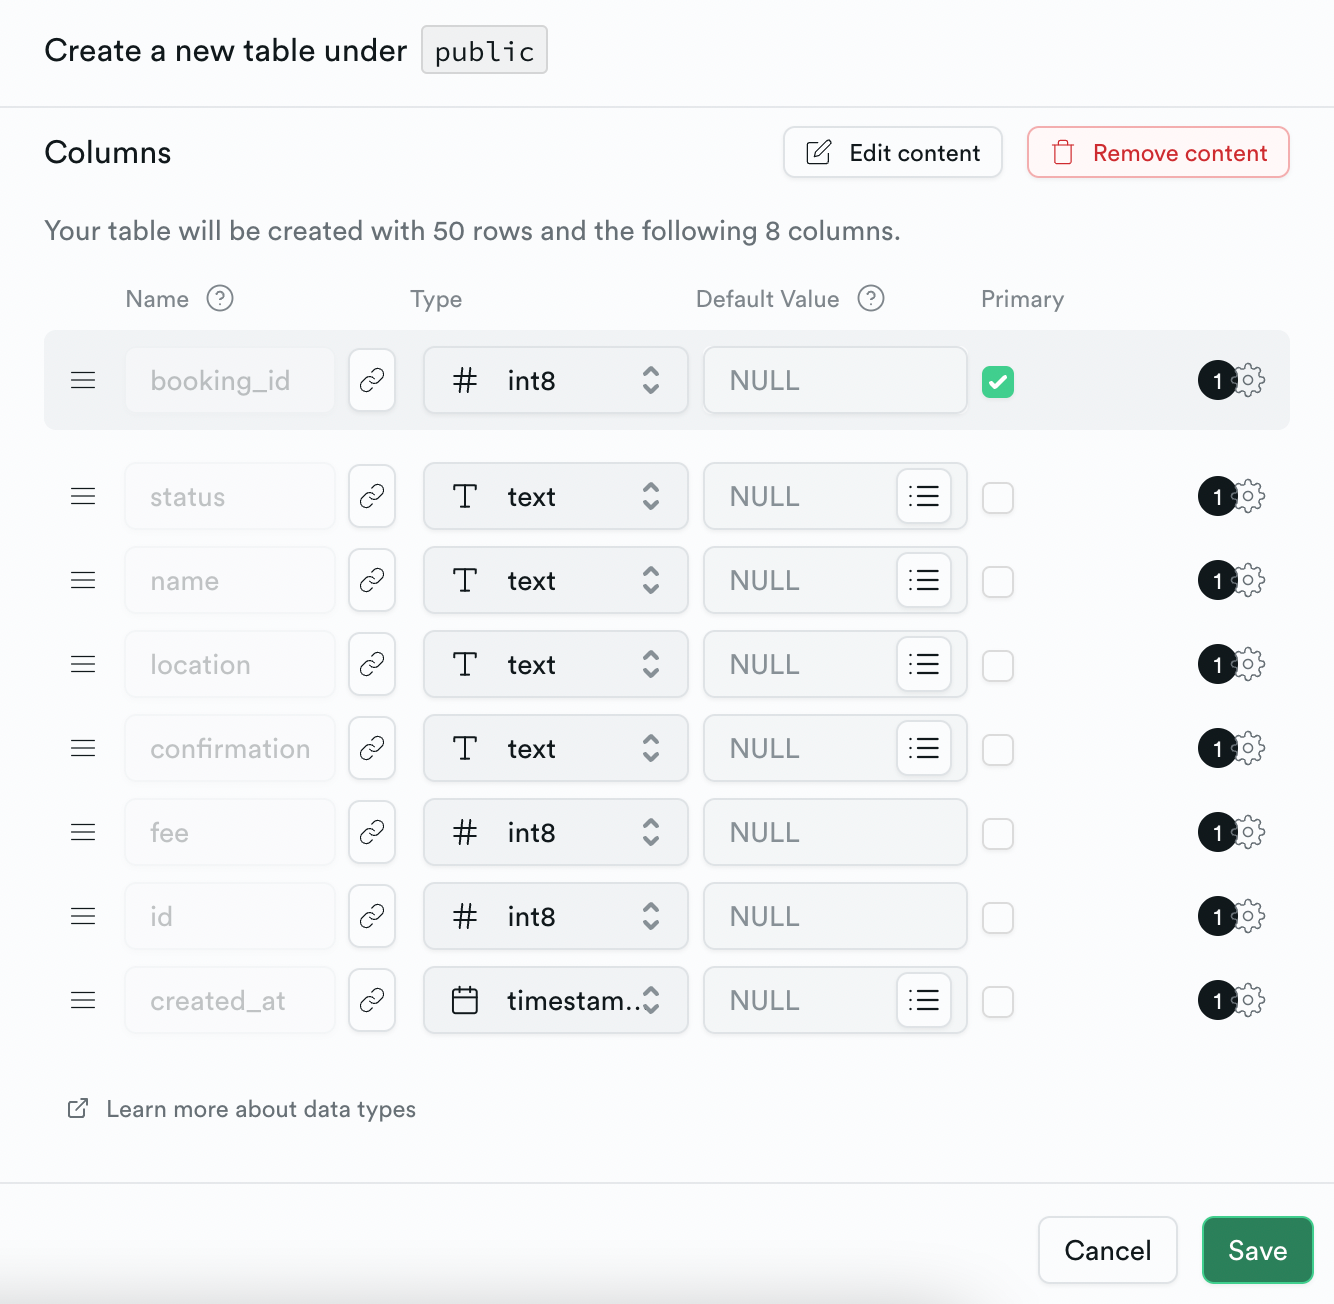
Once you have imported your data, you can use their simple UI to set up the data types, primary ID, default values, and additional settings like ‘is Unique’ and ‘Define as array’. This is a crucial step for ensuring that only the correct types of data can be input into the database.
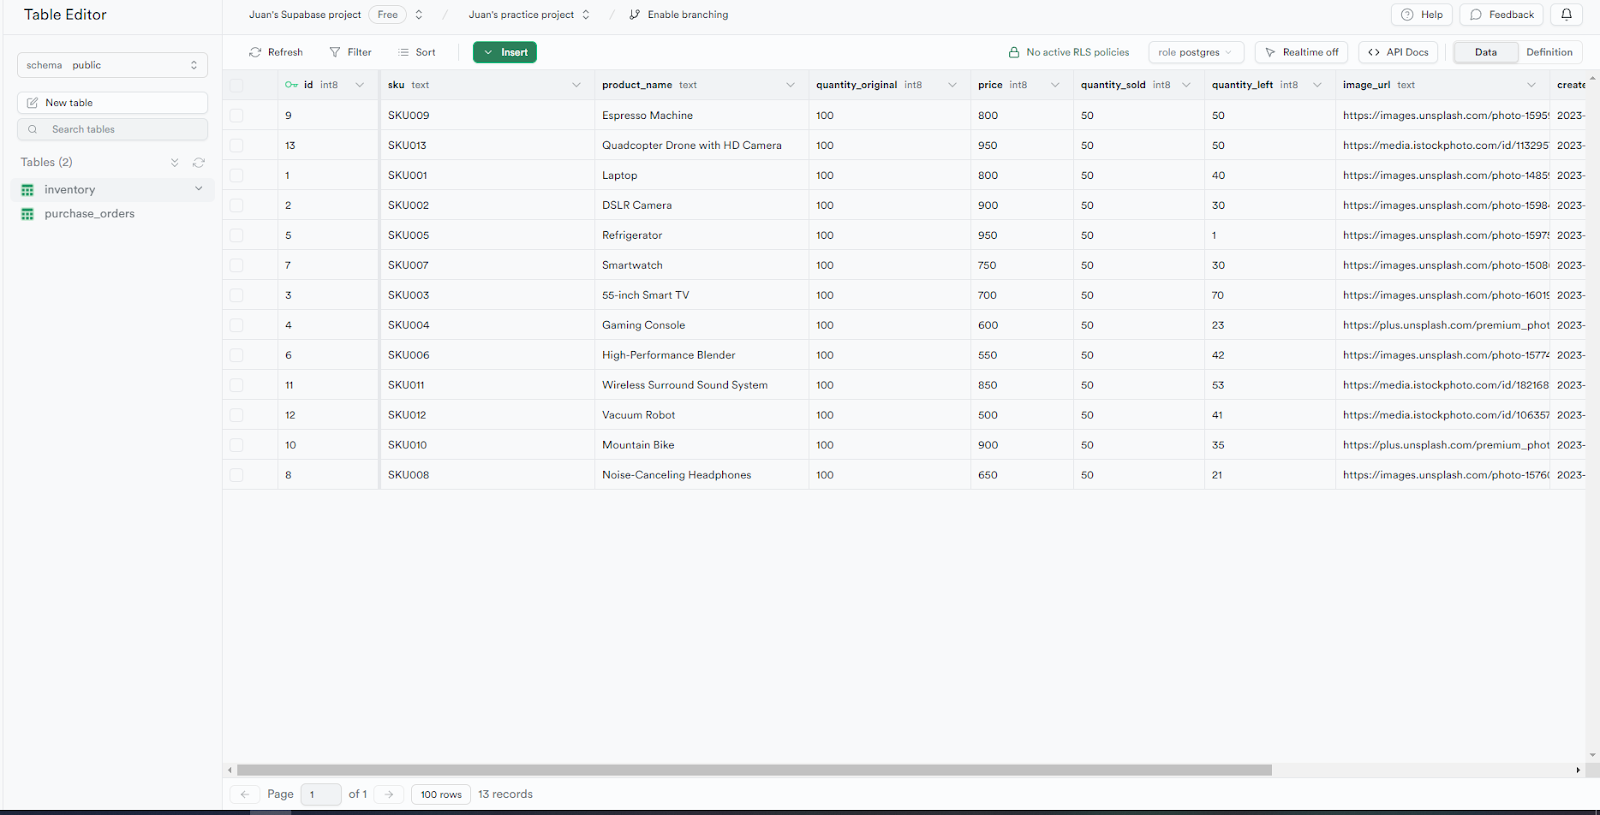
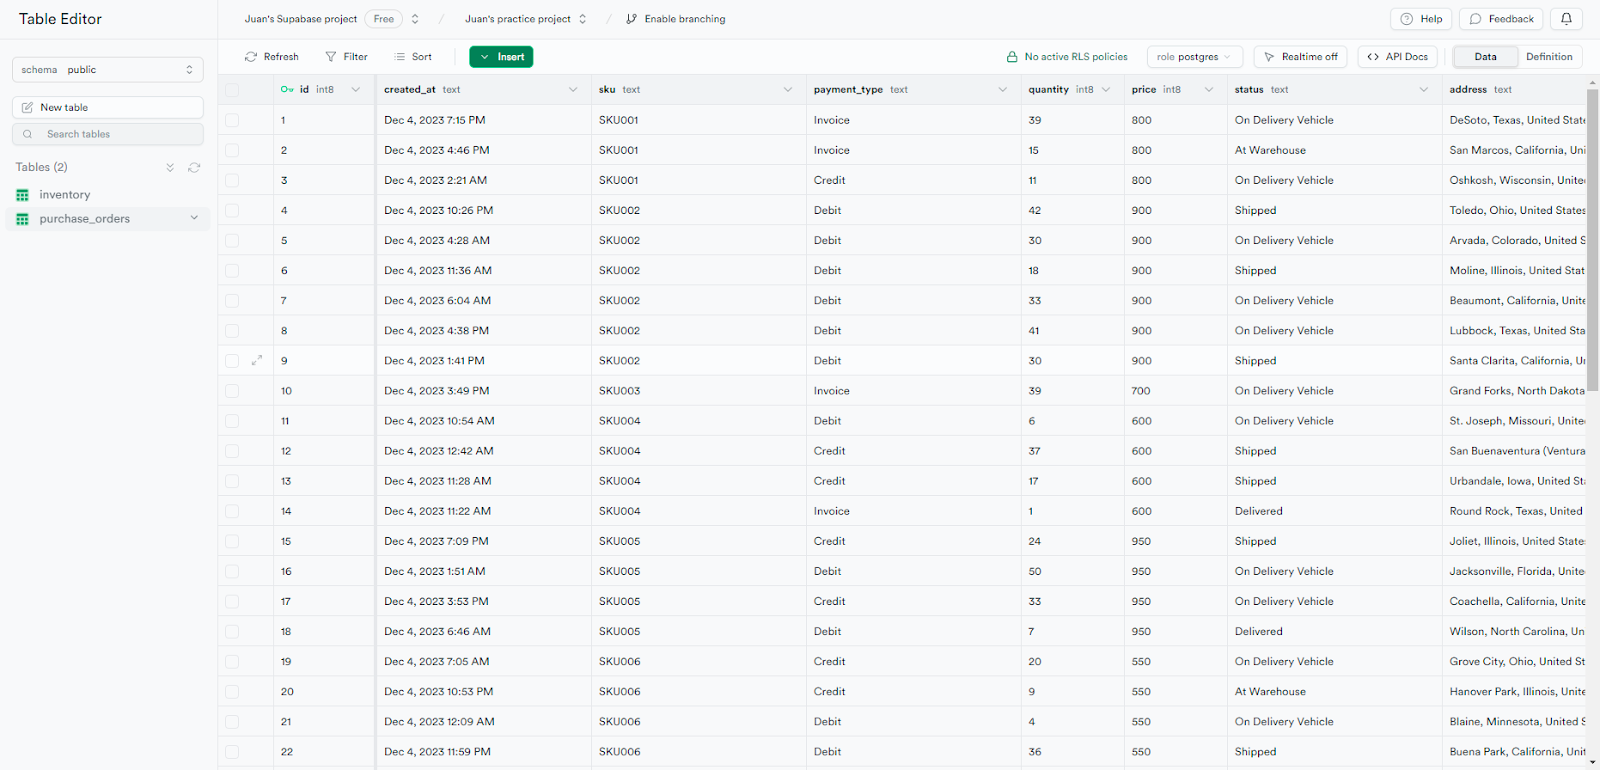
For this internal tool project, we have two tables, one for the purchase orders that updates whenever someone places an order and the second to store the inventory information, SKUs, etc.
For this example and for the sake of simplicity, let\'s imagine that the purchase orders and inventory numbers are created and updated by a separate system, and we simply want to use this data in a dashboard for better visualization and management options.
Here\'s what ours looked like:
Purchase orders
Inventory

In these tables, you can easily visualize the data just like a spreadsheet, but query it like a traditional SQL database.
Read more about Supabase and its features in our What is Supabase article.
Connecting Supabase auth to Retool
Now that we have our data set up in Supabase, we need to connect to it in Retool to build out our app frontend.
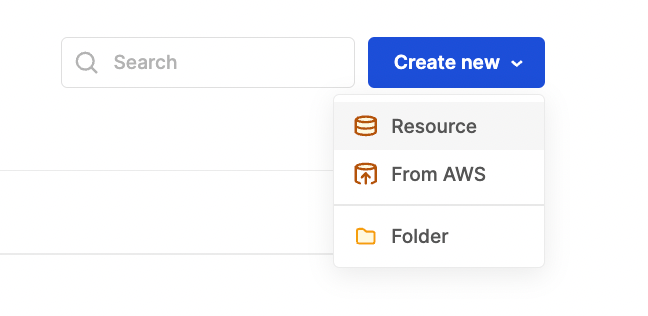
To do this, set up an account in Retool. Next, from the homepage, head to ‘Resources’ and add a new resource.
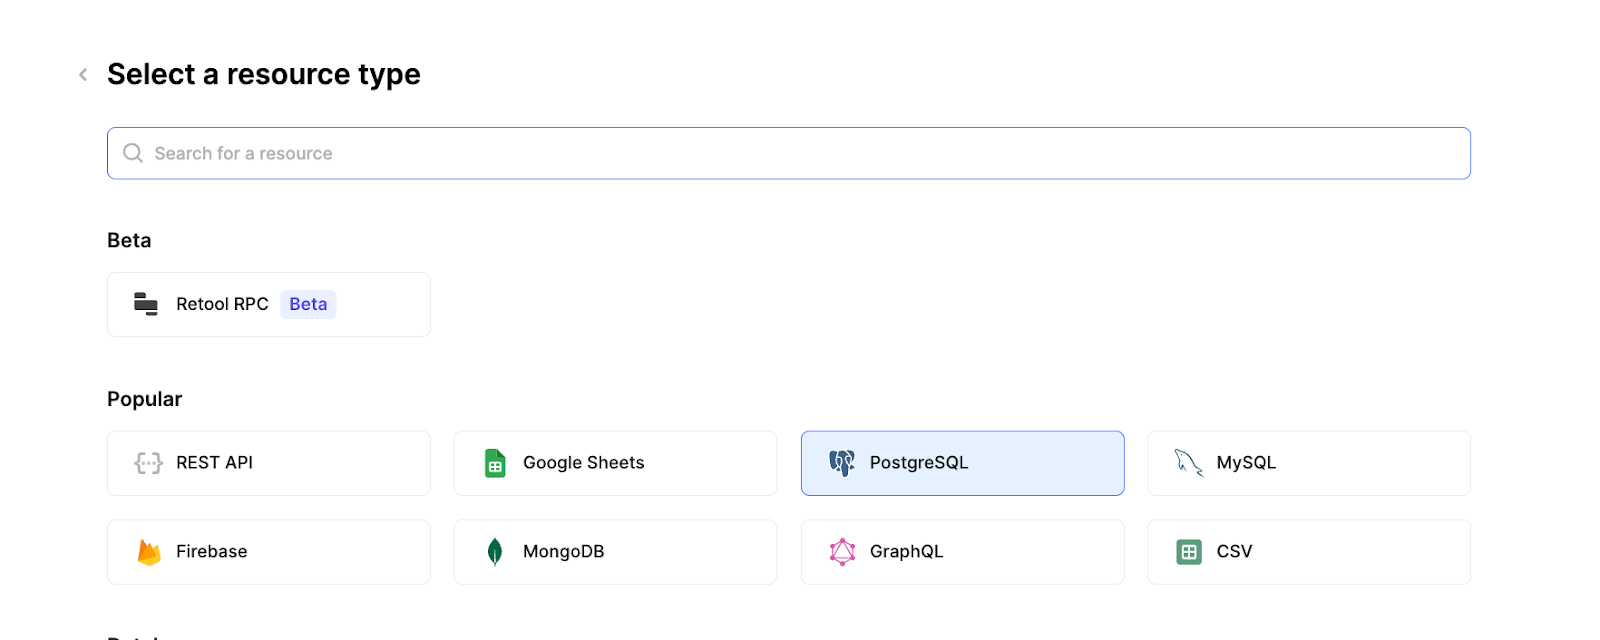
For Supabase, we’ll select PostgreSQL here so that we can query it with SQL from within Retool’s development environment.
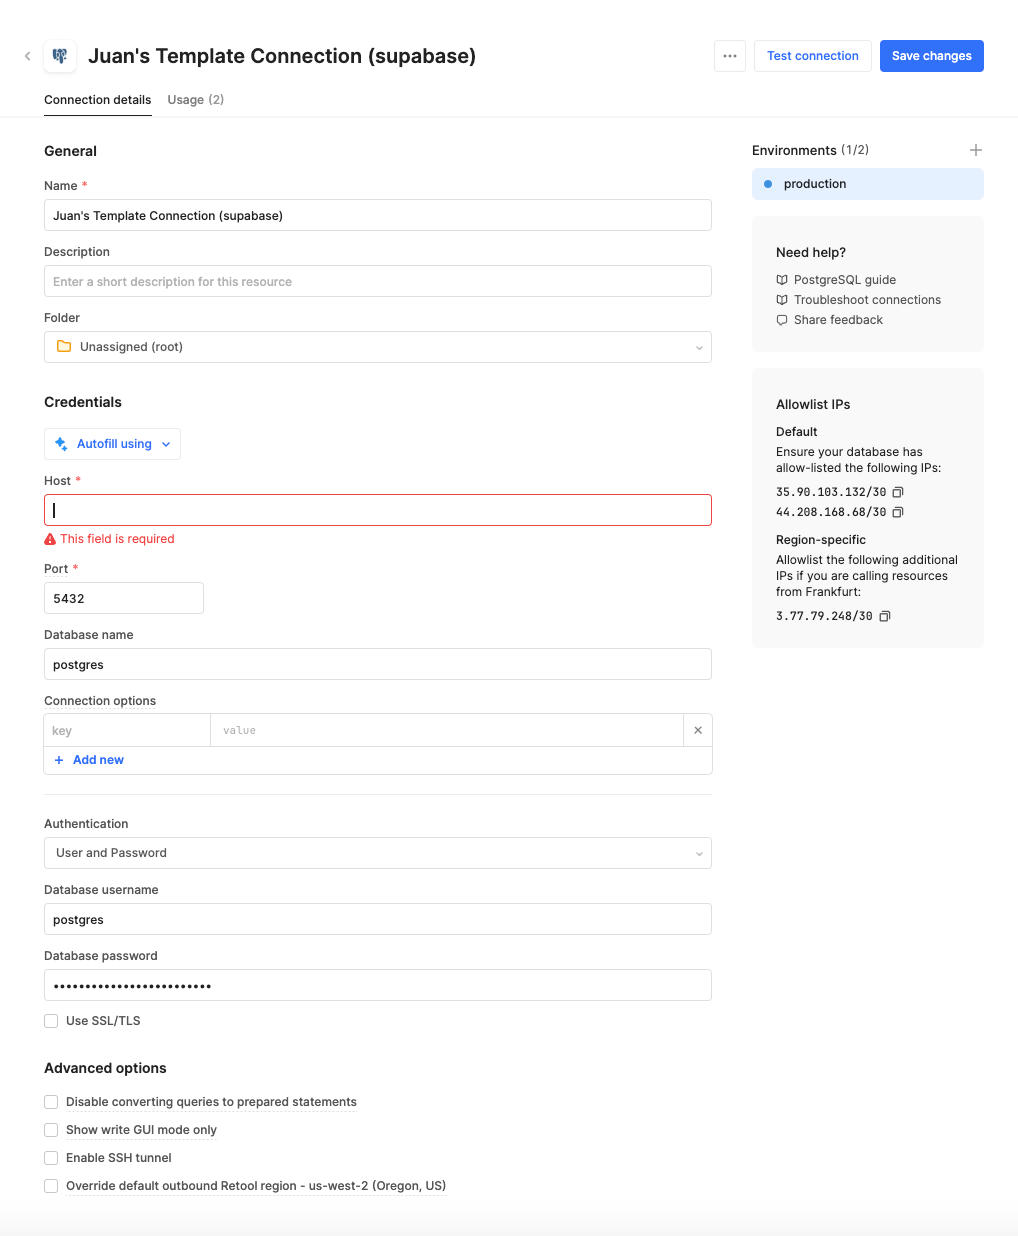
Then you’ll just need to input your own database information.
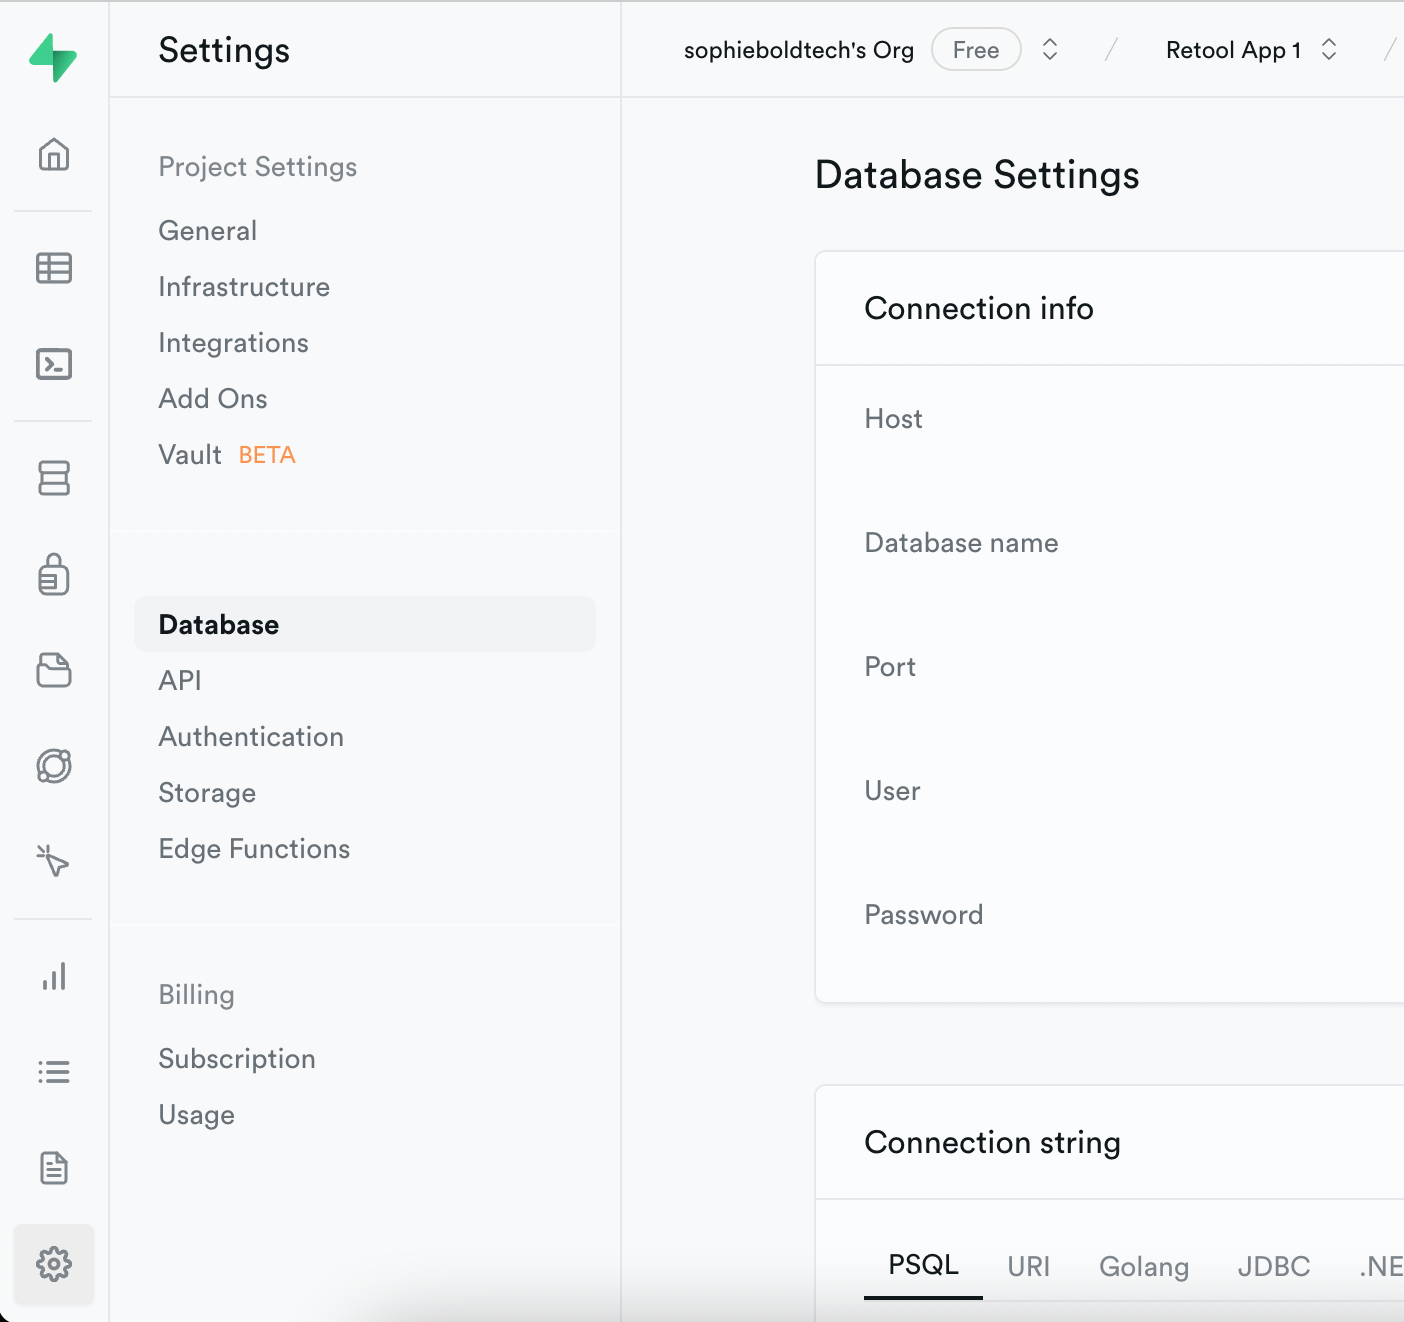
You can find the host, user, and password under Supabase -> Project Settings -> Database settings under the ‘Connection info’ section.
Here’s what our connection looked like (hiding the host credentials for security).
Test your connection to ensure you have entered the correct credentials, and once this is successful, you are ready to build out an app!
For more support settings up and connecting to Supabase, head over to the Supabase docs.
Building an order management system
Getting started with Retool
Next, set up your Retool account and open up a blank new Retool app from the apps page to get started building your UI.
When you open a Retool app, you’ll see a blank canvas and a panel on the left-hand side. On that panel, you have:
- ‘Add’ option to pull in your drag-and-drop components
- The component tree, which shows the app elements
- The code section, where you’ll set up resource queries and scripts
- A code search function
- The ‘State’ tab, which helps developers look deeper into the app’s code and variables
- The release/history tab to investigate past actions and processes, as well as version control
- Settings to control overarching app features
- The bottom bar also shows you release information, and has the button for the debugger to help you fix any problems. In the top right corner, you can preview and share your app. Once you drag a component onto the canvas, you can manipulate its properties and functionality using the ‘Inspector’ tab.
For this app, we have started the canvas with a header and sidebar frame that helps us to navigate to other apps in our internal system, which you can configure under the Component Tree.
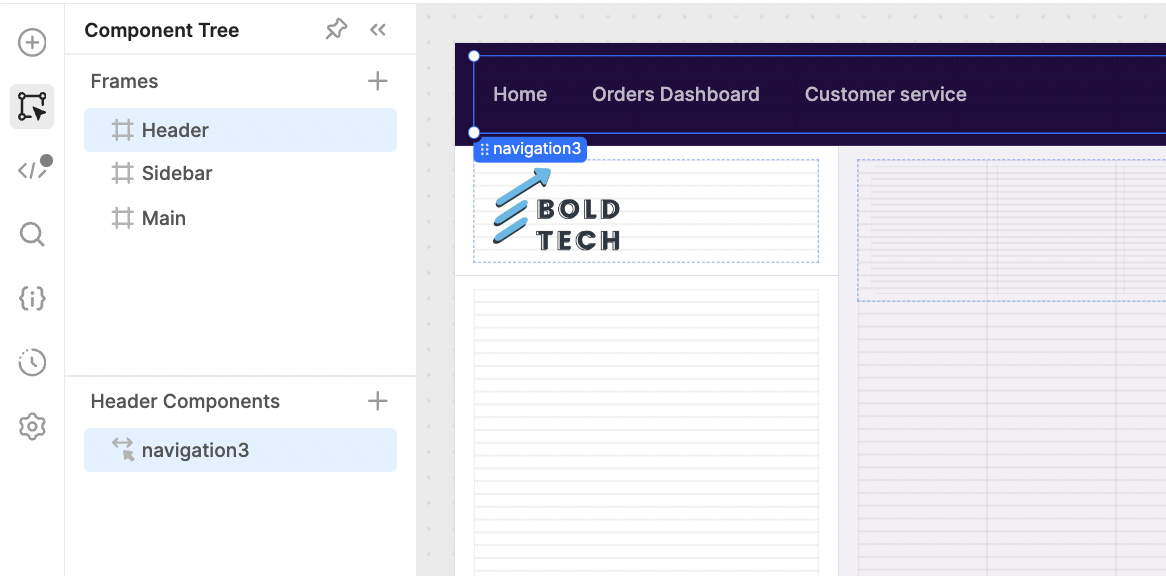
To add the links, you can pull in a ‘Nav’ component from the ‘Add’ section on the left panel and configure the links to your other apps.
Our header bar links to our other apps in Retool, and we’ll add another Nav component in the sidebar which will help us to switch between the two apps we will build today.
Setting up two app ‘views’
First, pull in a Navigation component and set the menu items to our page names, in this case ‘Purchase Orders’ and ‘Inventory’.
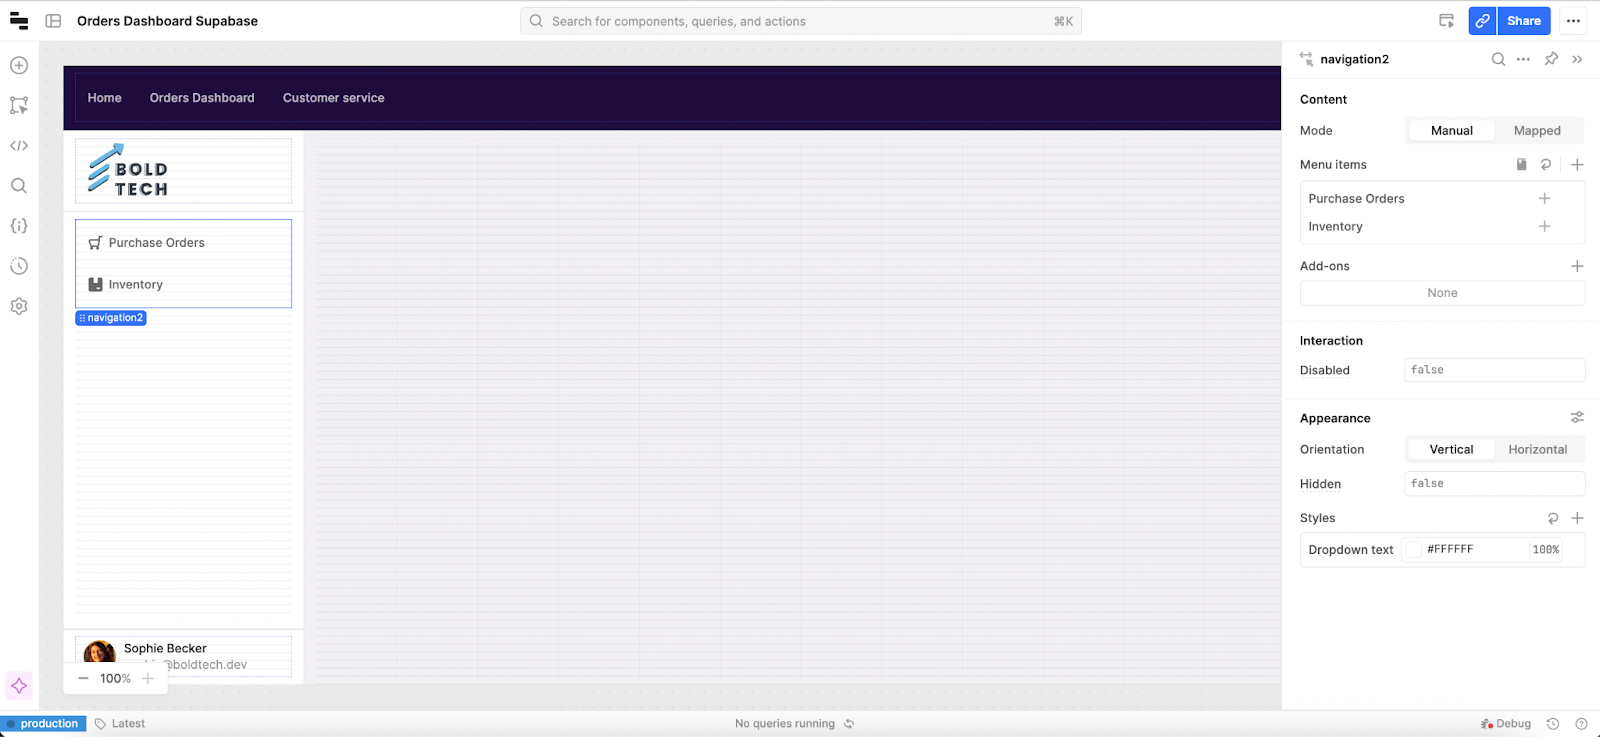
To provide our app ‘views’ for the inventory and the purchase order dashboards, we will use a container component. Drag a Container in from the component menu and toggle the container to allow ‘multiple views’ in the Inspector.
Then set a value for each view:
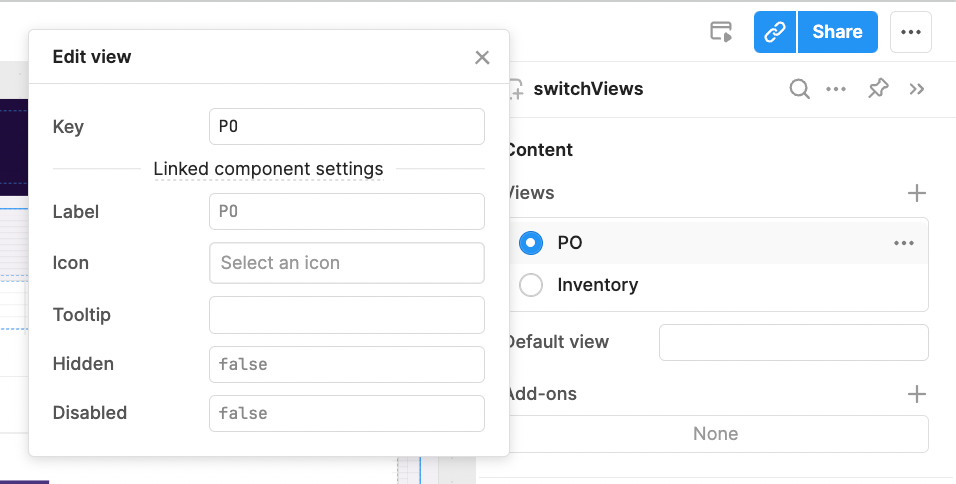
To connect the navigation component to the views, we’ll set an event handler for each option to switch the view according to the index.
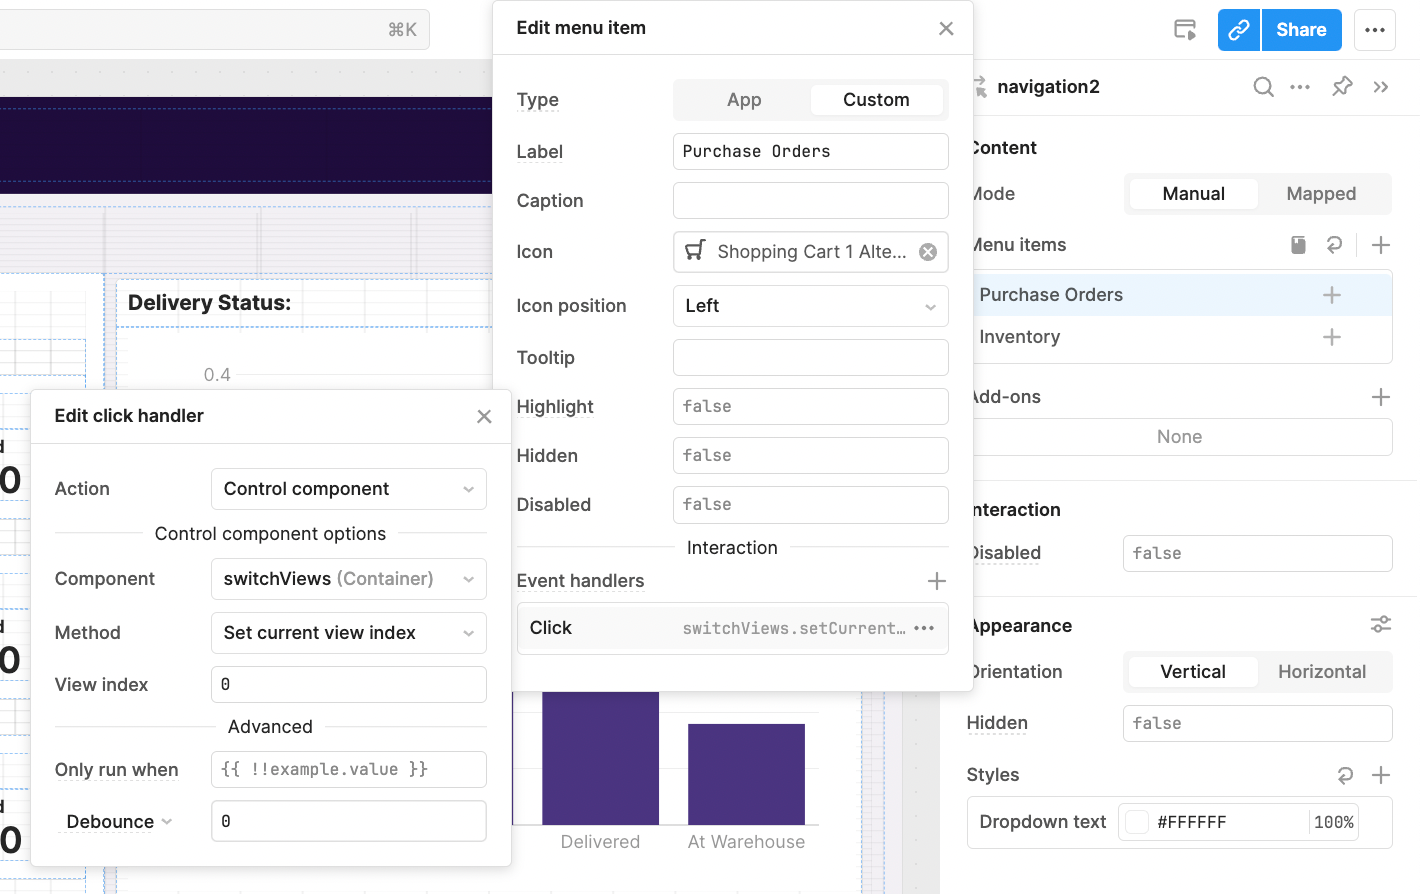
Under ‘Menu items’ in the Nav component, select each menu item and add a click handler at the bottom of the menu item editor. Set this to ‘Control component’ and set the component to your container (here it is named ‘switchViews’). The first view index is 0, then 1, 2 and so forth. You can also set the ‘method’ of the click handler to be the value of the container view if you have multiple views.
Now we have a container with two blank ‘views’ and a navigation component whose buttons will switch between the two. Next, let’s fill the first ‘view’ with some functionality! We\'ll be building out the inventory app view in the second part of this tutorial.
Adding a table and filters
To display our data, we first need to pull in our purchase order data from Supabase. To do this, we will create a new query in the ‘code’ panel and select our Postgres resource. Here, we can write any SQL to query the database.
For this table, we just need to write ‘Select * from purchase orders’. We use ‘as po’ to simplify references in the future.
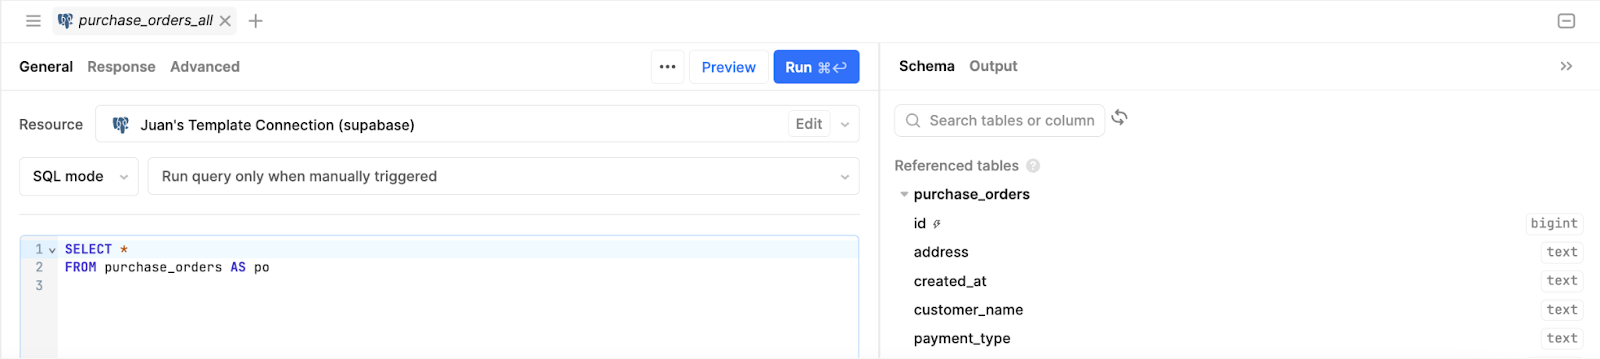
SELECT * \nFROM purchase_orders AS poYou can learn more about SQL in Retool in our blog post.
Name this query to something like "getPurchaseOrders" for better organization. Now, pull in a table component from the + Add section onto the canvas. Typically, the data will default to the first query we just made, but if not, select it under the dropdown.
Now, you can use the table component UI to configure your column headers exactly as you need them. Retool provides plenty of handy options to set up your table with tags, buttons, collapsible rows, and more.
For our table, we have set up the columns to present data neatly in an easy-to-read format by associating values to the correct data types, such as Price in ‘Currency’ format, set to USD. Status and payment type are set to be colored tags so that users can quickly scan the table for information.
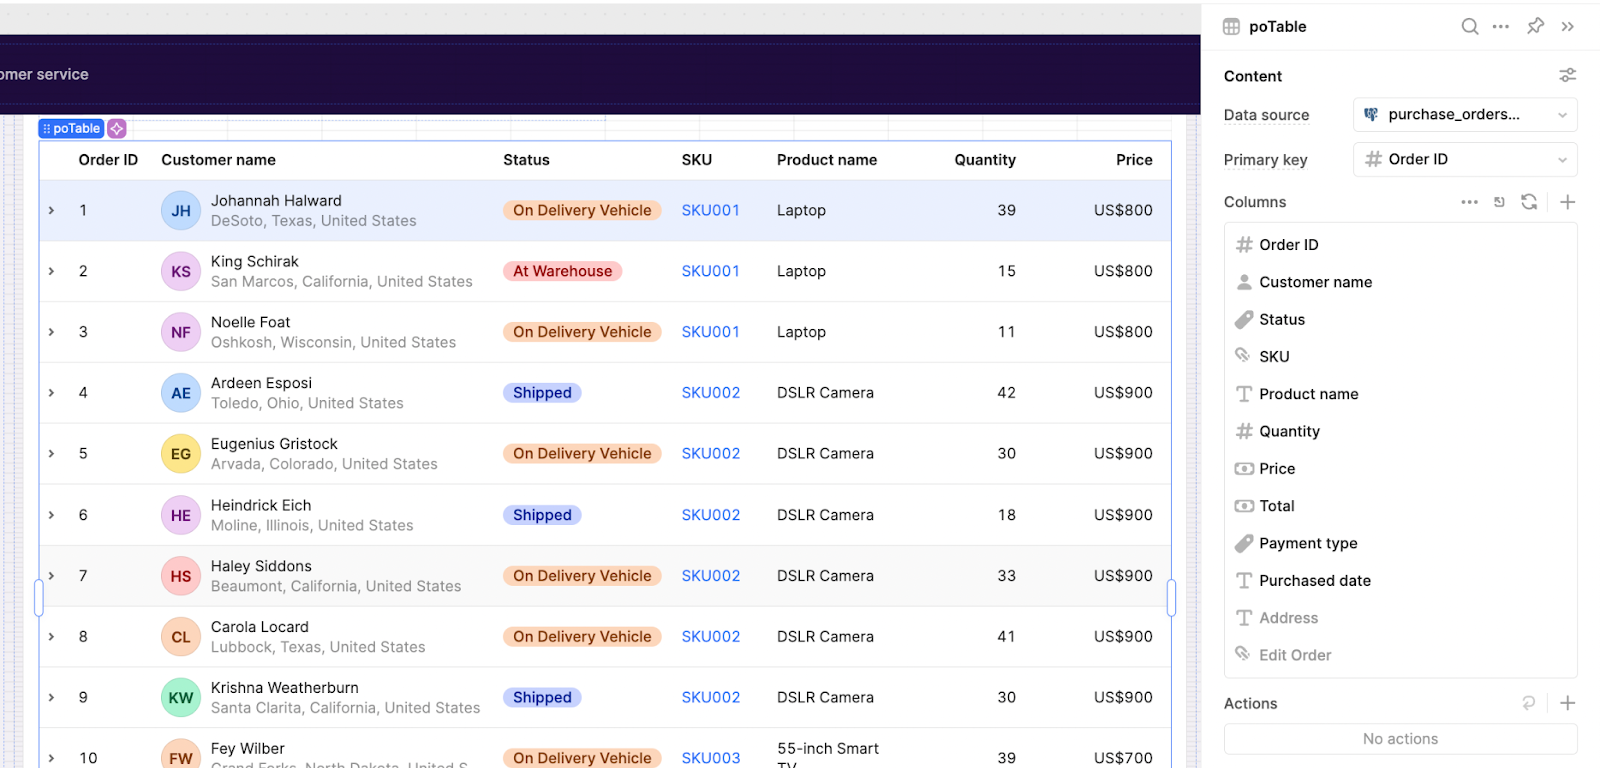
We have added the address as a caption to the customer name column to keep this customer data in a single line. To achieve this, we clicked on the customer name column and set the caption to the current row’s address:
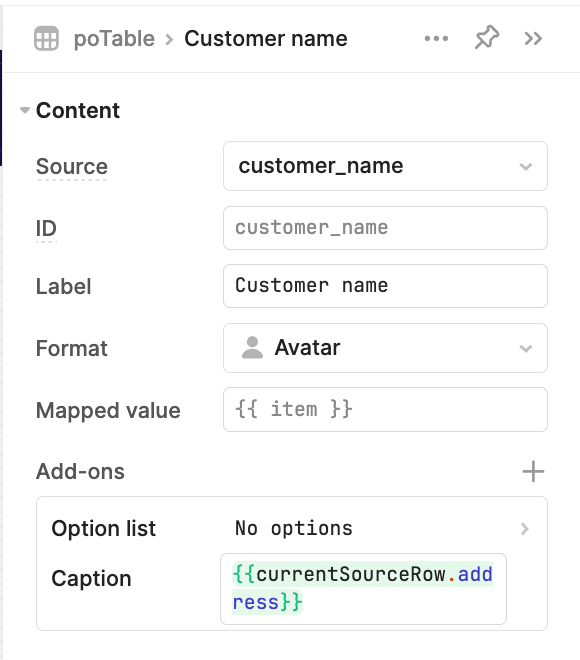
Additionally, our SKU column is set up to be a link that opens the product information in a modal window, but we’ll come back to how to do this later in the tutorial.
Add table filters and advanced features
To make sure we can search our data quickly, we are going to add a series of filters. Firstly, we’ll pull in a ‘tabs’ component to provide a slick UI to filter the statuses.
Since we only have four values, we have manually added the values to match the status options in the database. The only exception is ‘Unfulfilled’, whose value is set to the status ‘On delivery vehicle’ in the database.
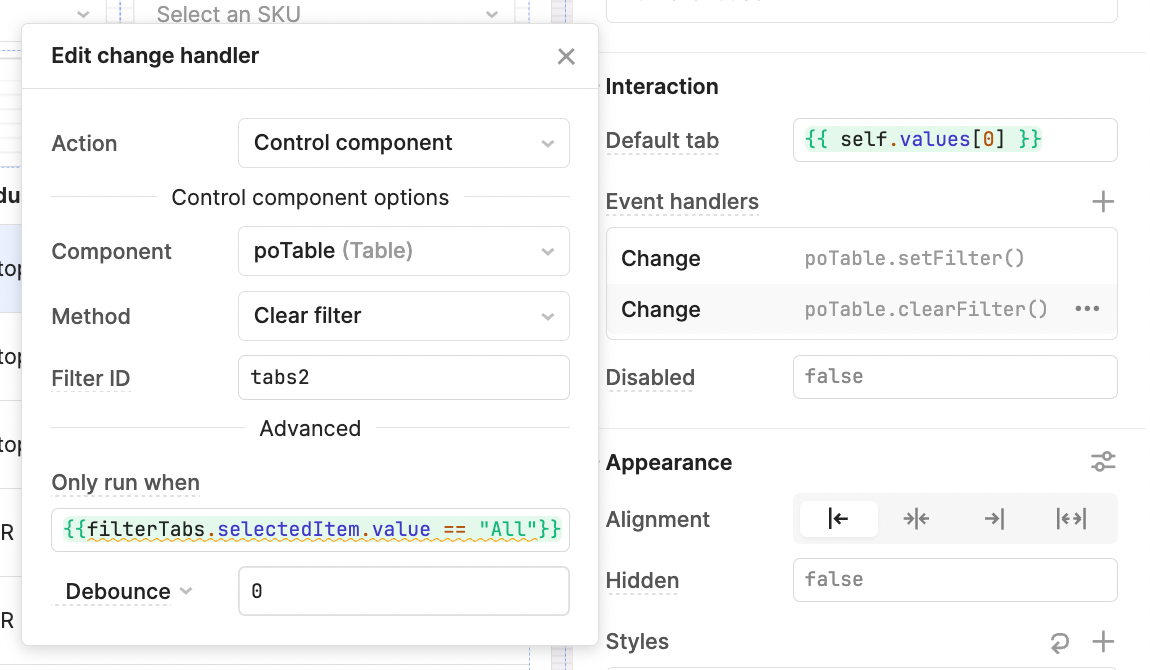
To filter the data, we added two change event handlers. The first sets a filter in the table to the corresponding status if any button except ‘All’ is clicked:
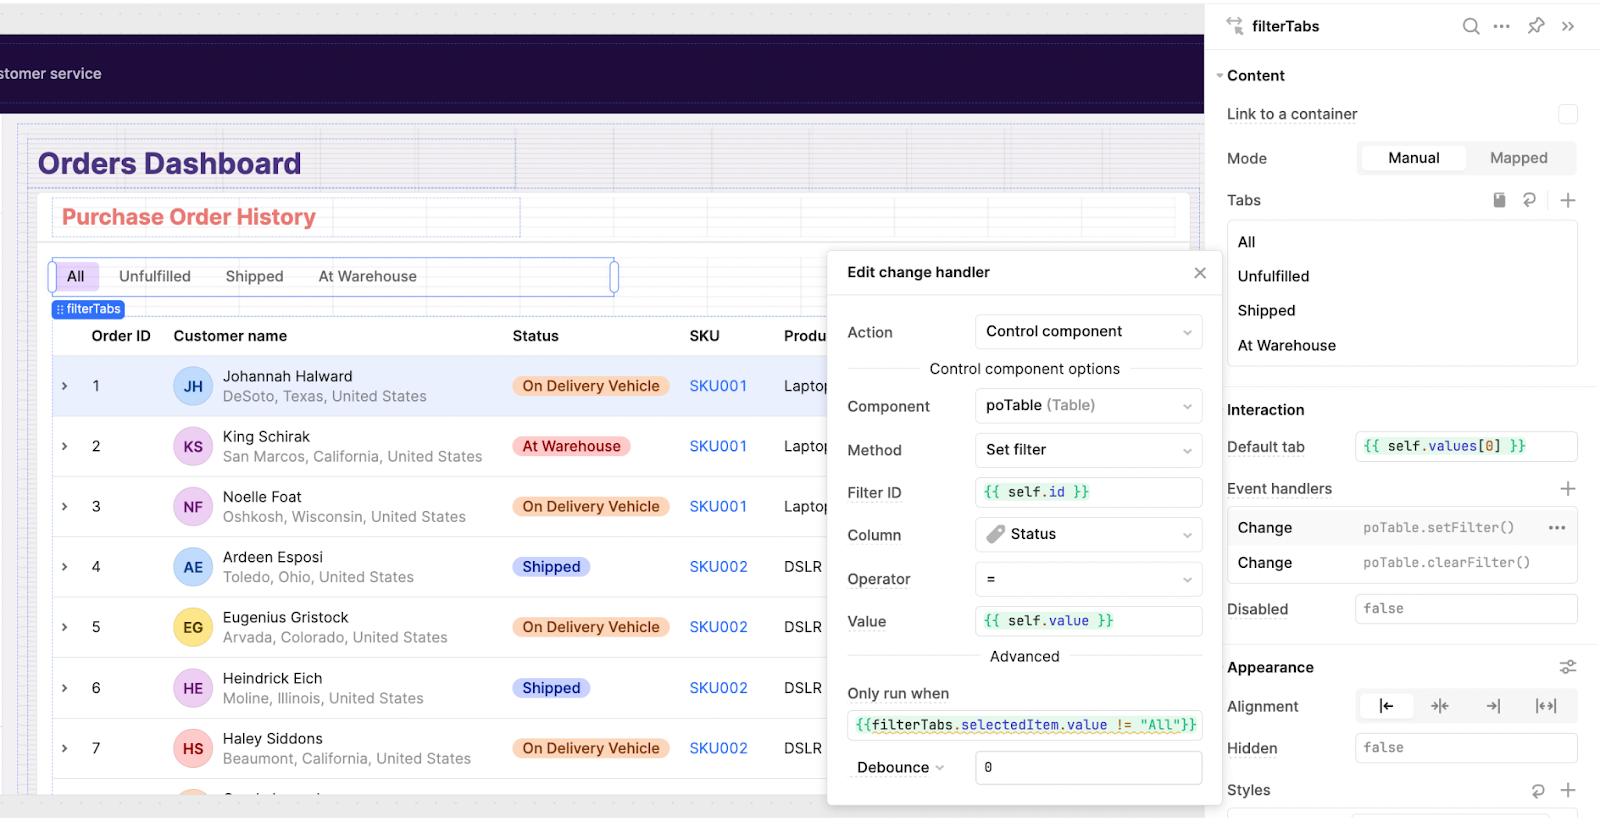
The second clears the filter if ‘All’ is clicked.
Next, we’ll add four filter options for the remaining data. We added three ‘Select’ components and a number input for the ID. The values are populated from the backend data, and mapped to the values and labels like so:
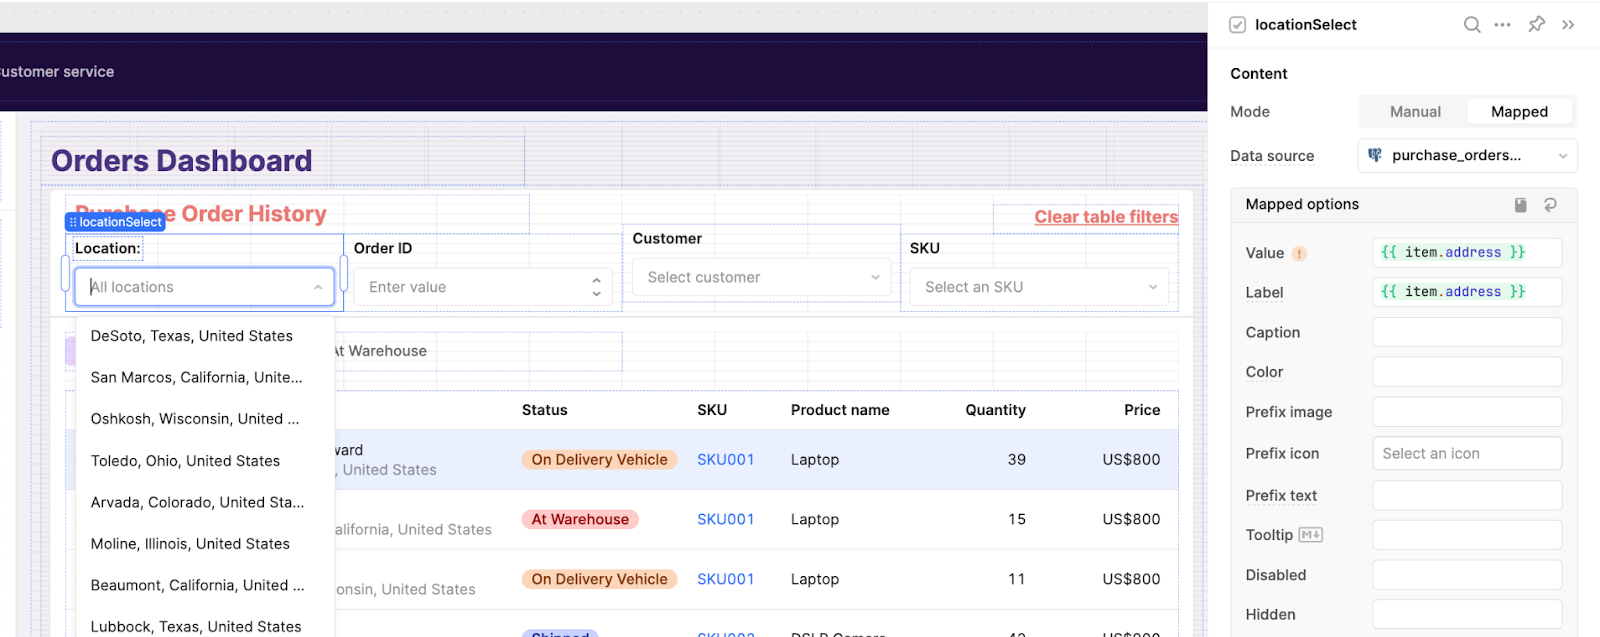
This means the dropdown will automatically include all unique options in the backend, as it’s connected to the purchase_orders data under the data source.
Like with the tabbed component, we use an event handler to set the filter on the table:
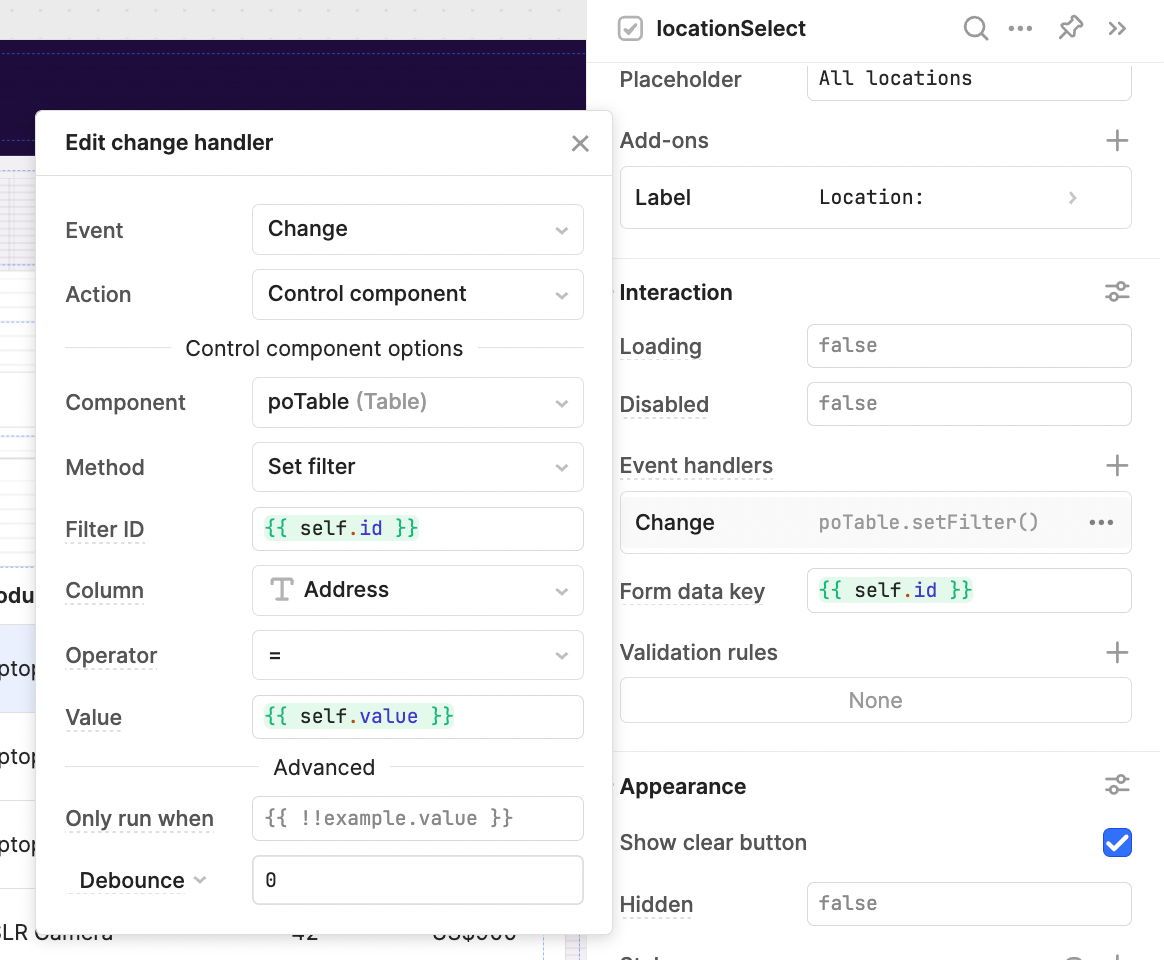
📌Note: while it’s possible to set filters using SQL, this means that the query is rerun every time you change the filters, and can slow app performance. Instead, we recommend using SQL to pull all data in (updating only when changes are made) and to filter on the frontend using JavaScript and event handlers like here. We applied the same settings to the other filters for Order ID, Customer, and SKU, according to the column they filter.
Finally, we added a \'Clear filters\' button to ensure we can quickly clear all filters and see all data. For this we use a link component and set the following event handler:
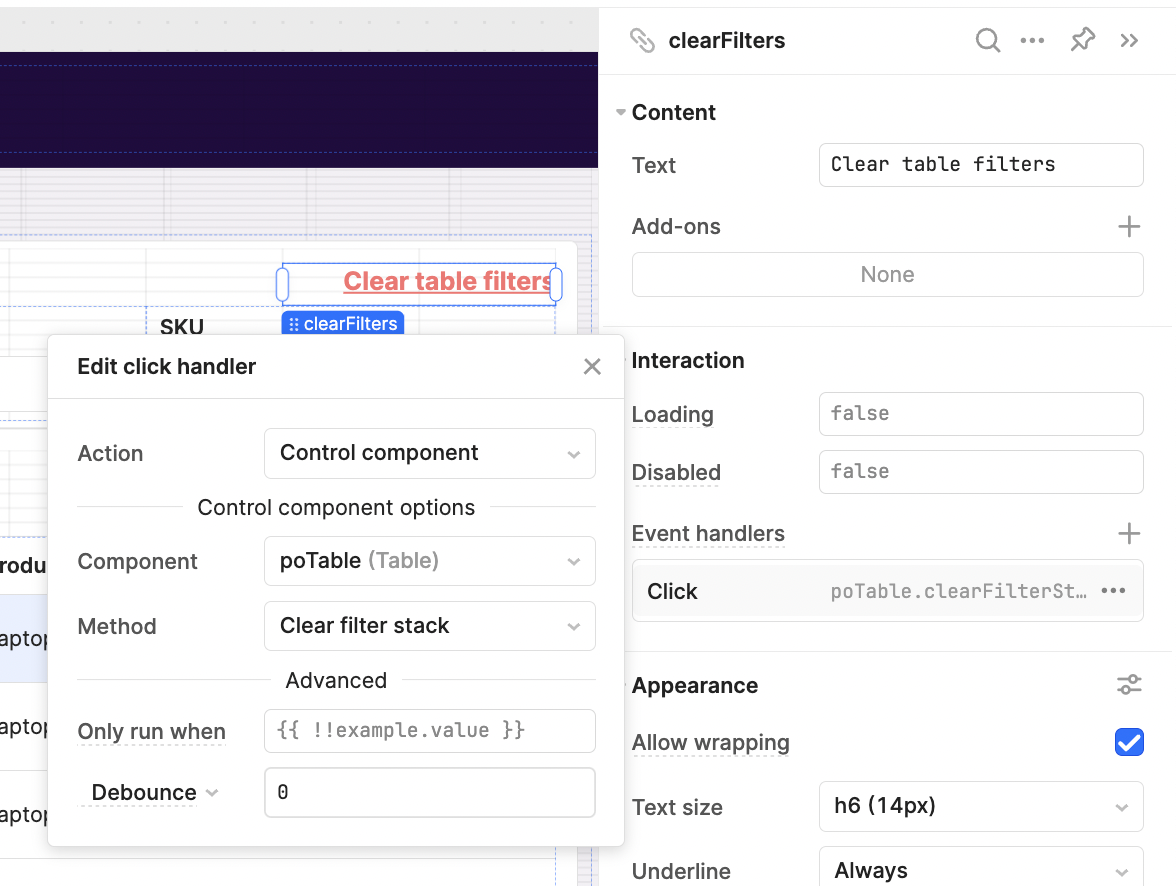
Now our users can quickly and easily filter the table to find the exact data they need!
Add a collapsible row to the table
To add a more advanced feature to our table, we used the ‘collapsible row’ option of the table component for a useful UI option to view customers’ additional orders. To do this, we first toggled the collapsible row feature ‘on’:
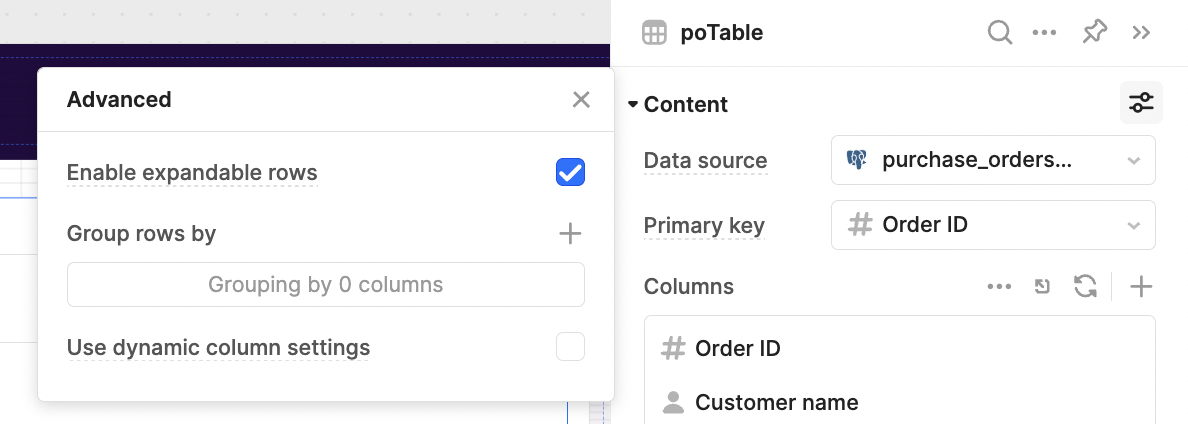
This adds a canvas to each row, available when the dropdown toggle is clicked. For our table, we want to display a collection of all the orders from the same customer, so we pulled in a text component and table to display this:
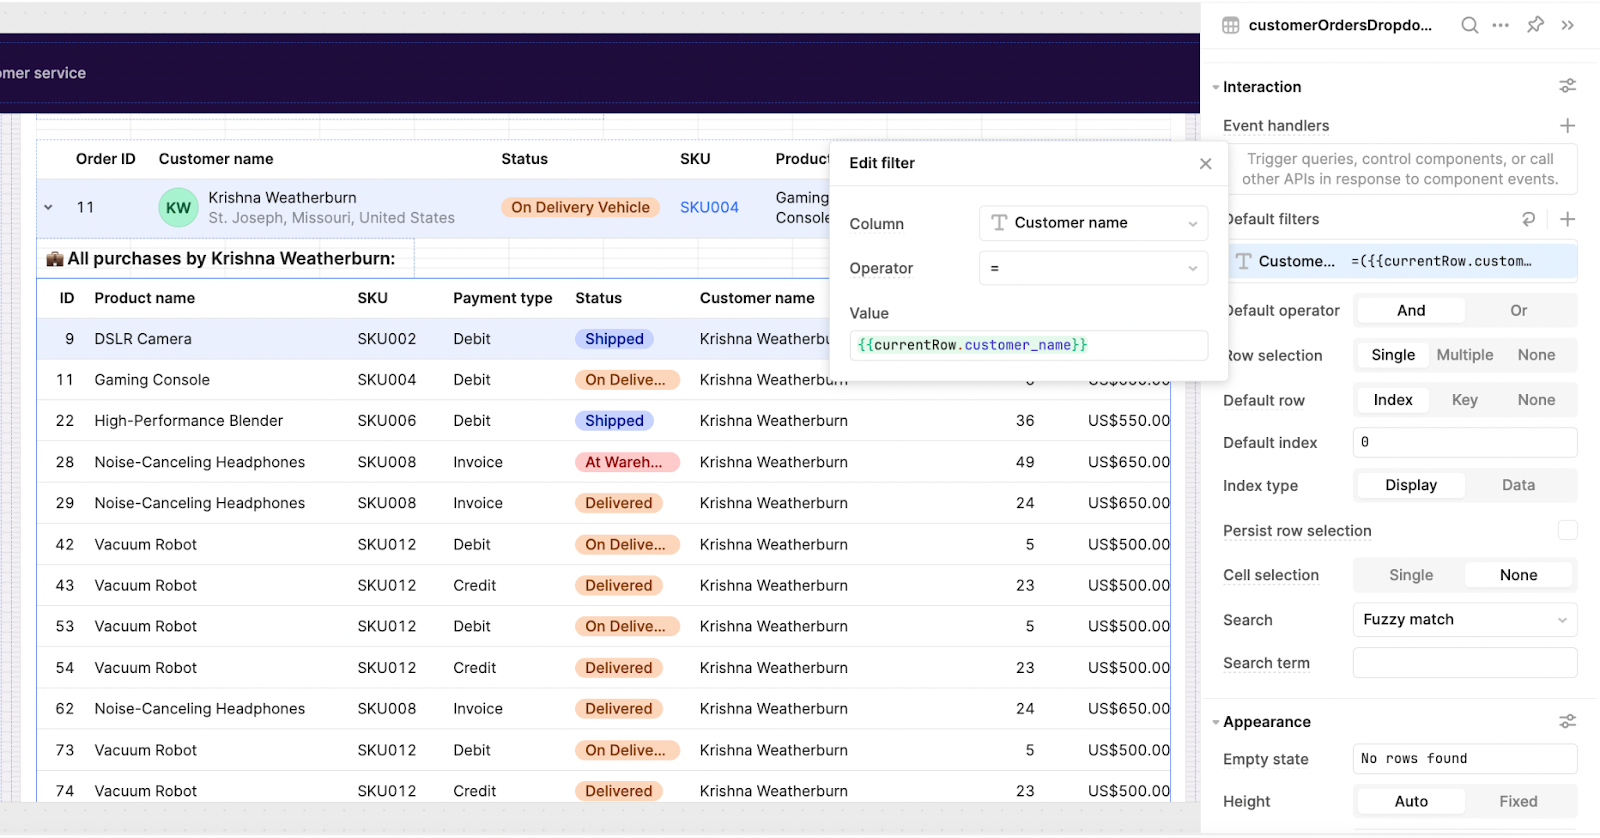
The table format is set up in almost the same way as the original table, but we have added the filter of the currentRow.customer_name to only show a summary of their orders. The text component changes dynamically using this code:
###### 💼 **All purchases by {{currentRow.customer_name}}:**
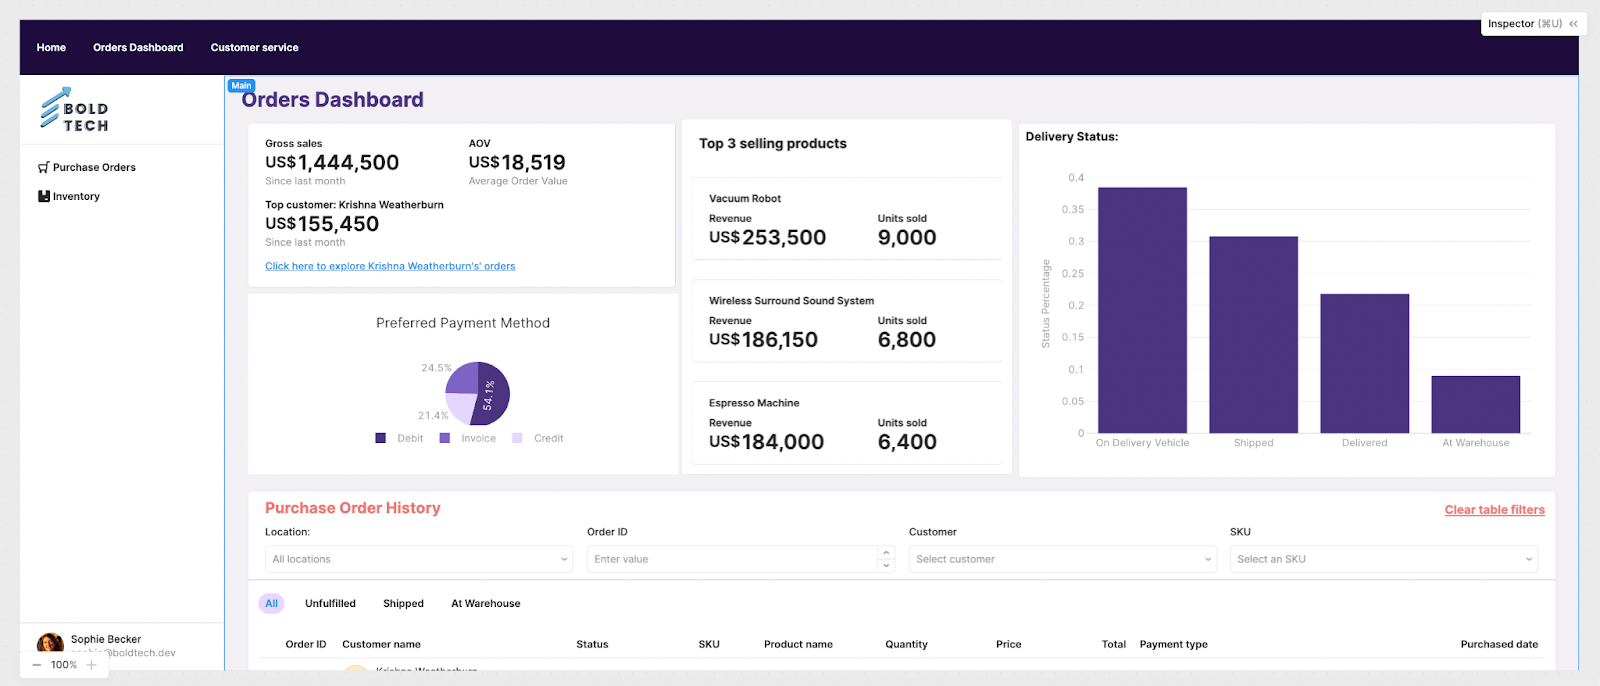
Now that our table is set up with clearly presented data and some useful filters, let’s add in some graphs and summary statistics to make this a dashboard with plenty of helpful information.
Adding graphs, chats, and summary statistics
Here’s a peek of what this will look like:
Summary statistics
To set up our ‘Gross sales’ stat, we pulled in a statistic component with the following Lodash JavaScript code to complete the calculation.
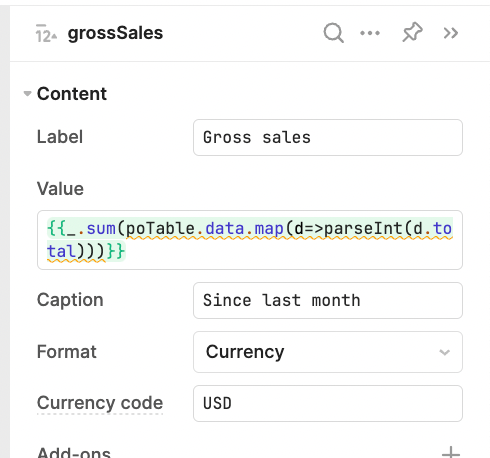
Using the Lodash _.sum function, we simply add up all the values in the ‘total’ column. The rest of the code maps the data into an array of integers for the Lodash function to calculate.
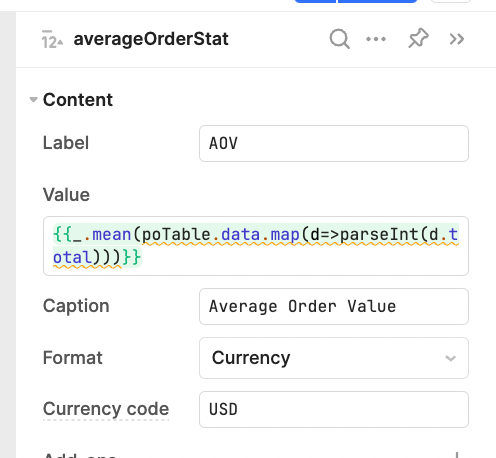
To set up the Average Order Value (AOV), we similarly use the Lodash function _.mean to find the average of those totals.
For our other stats, we have used some more complex SQL queries to work with the data. Another benefit of a Postgres database like Supabase is that it allows for the type of standard SQL data manipulation that engineers are used to.
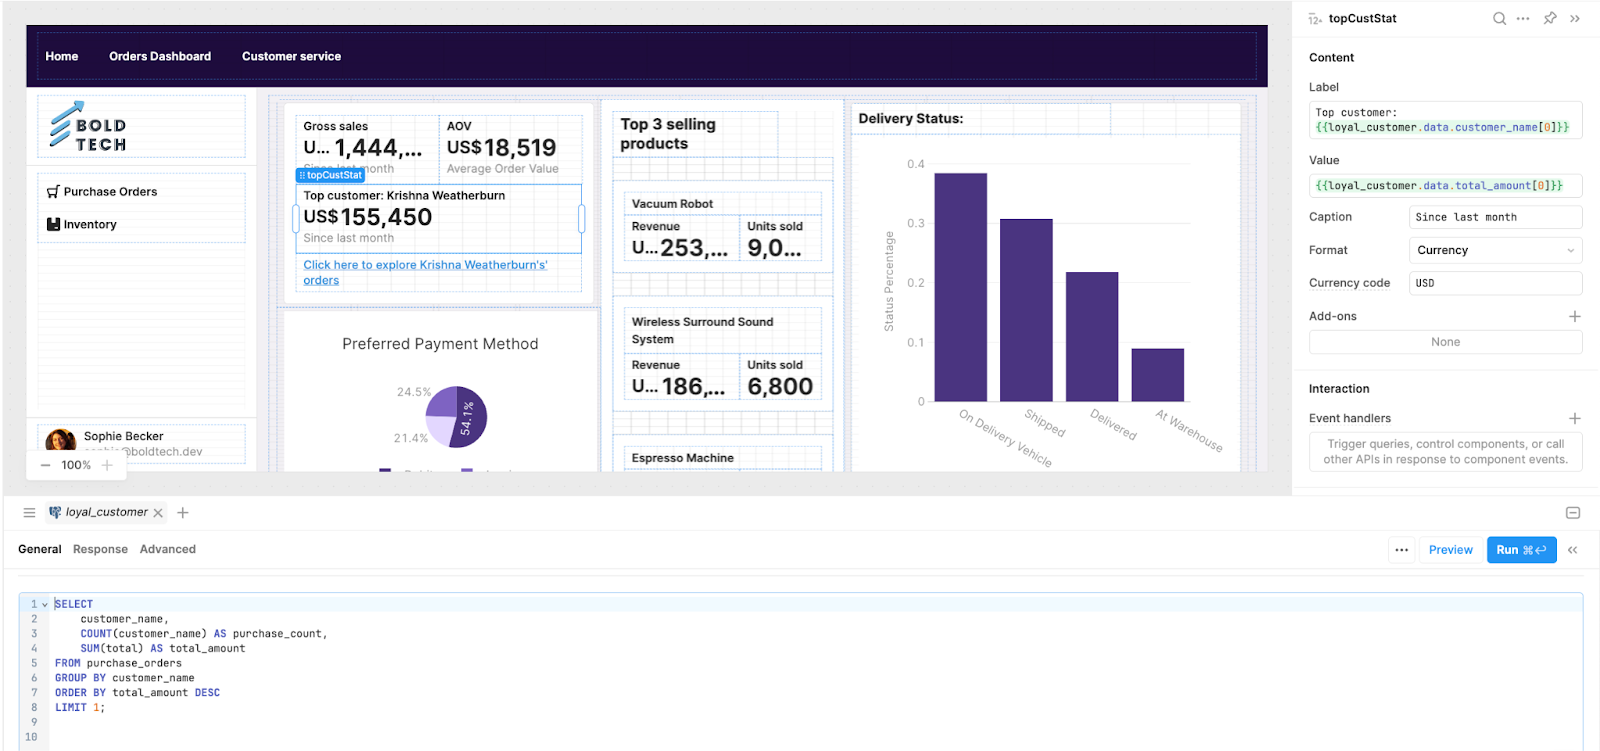
Top loyal customer statistic (SQL)
For our top loyal customer stat, we use SQL to select and count the customers and sum the totals of their orders. It is then ordered by the largest value and the top one is returned using Limit 1. In the statistic component, we use this query and select this first result (the highest value customer) using the [0] index.
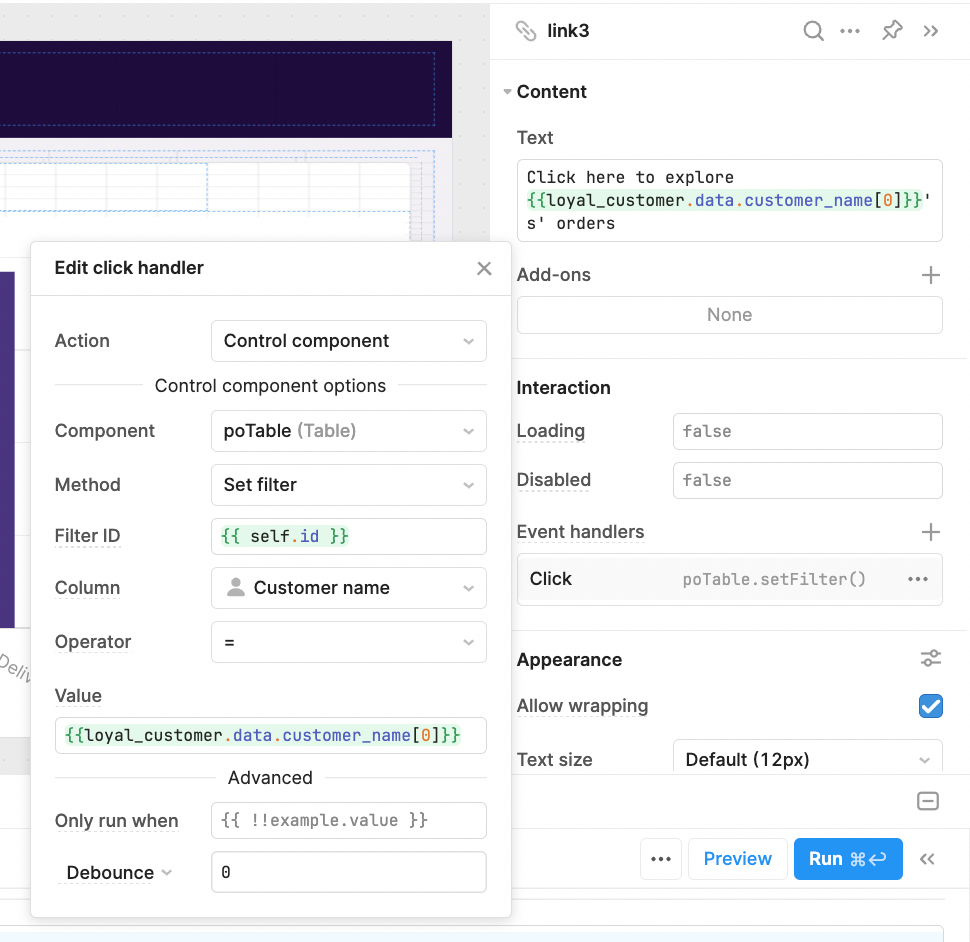
The link component then filters the table by that customer using the code and event handlers below - the filter event handler is just like the ones we set up earlier.
Pie chart
For the pie chart, we have used the chart component to calculate the percentages automatically. The value labels are connected to the payment_type, and the dataset is connected to the total, with the aggregation type as ‘Sum’.
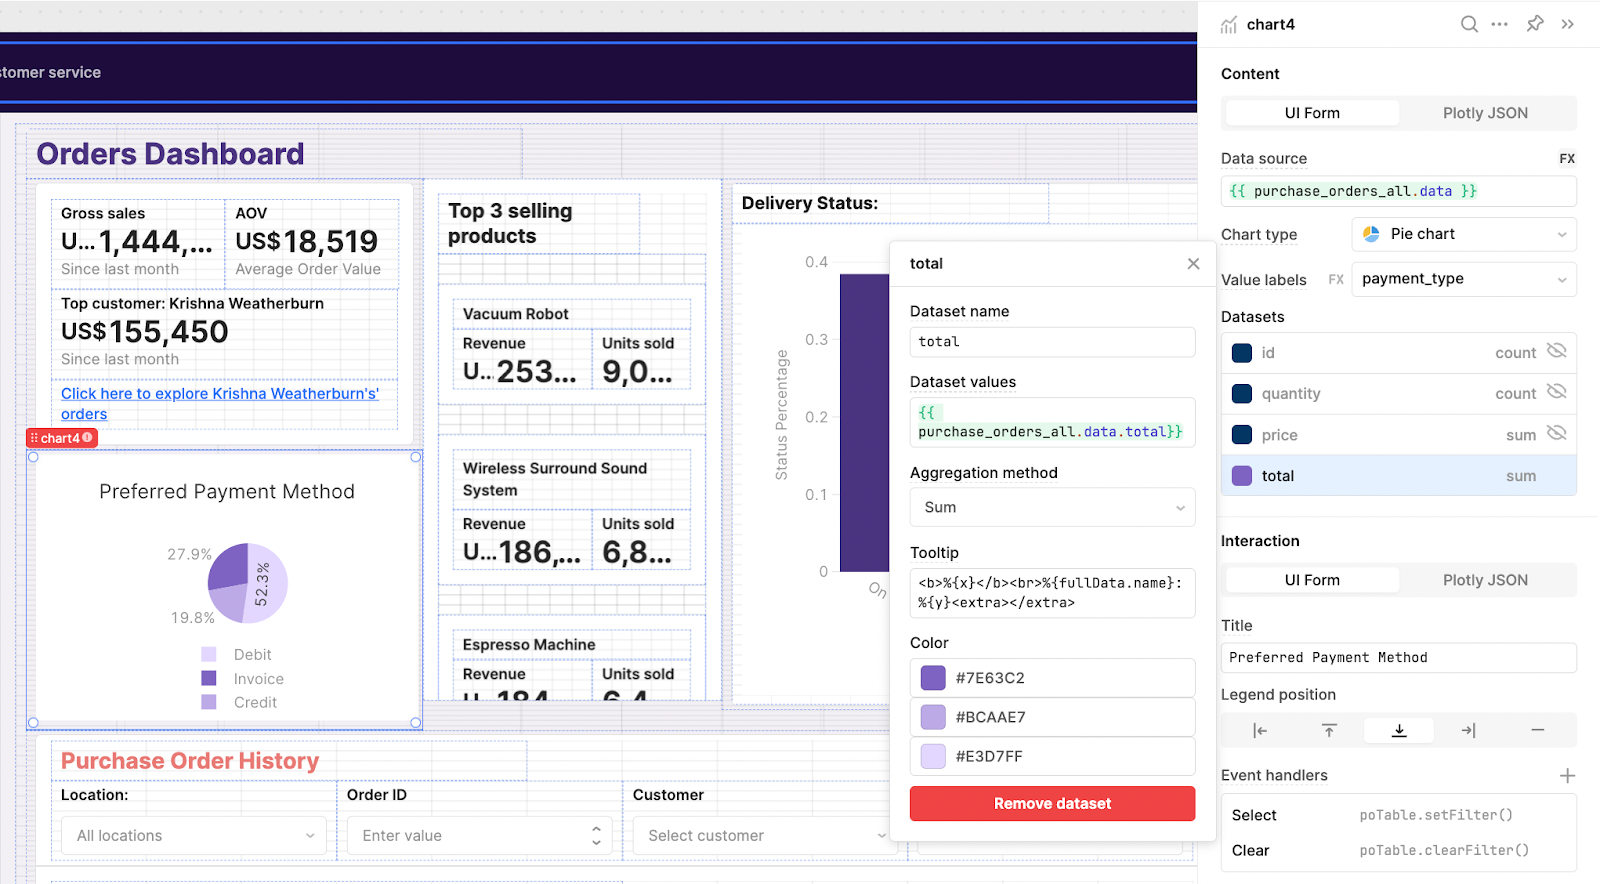
For added functionality, we’ve also set the pie chart as an additional filter on the table. When a segment is selected, the table is filtered by that payment type. So if the ‘Debit’ slice is clicked, only ‘Debit’ purchase orders are shown in the table below.
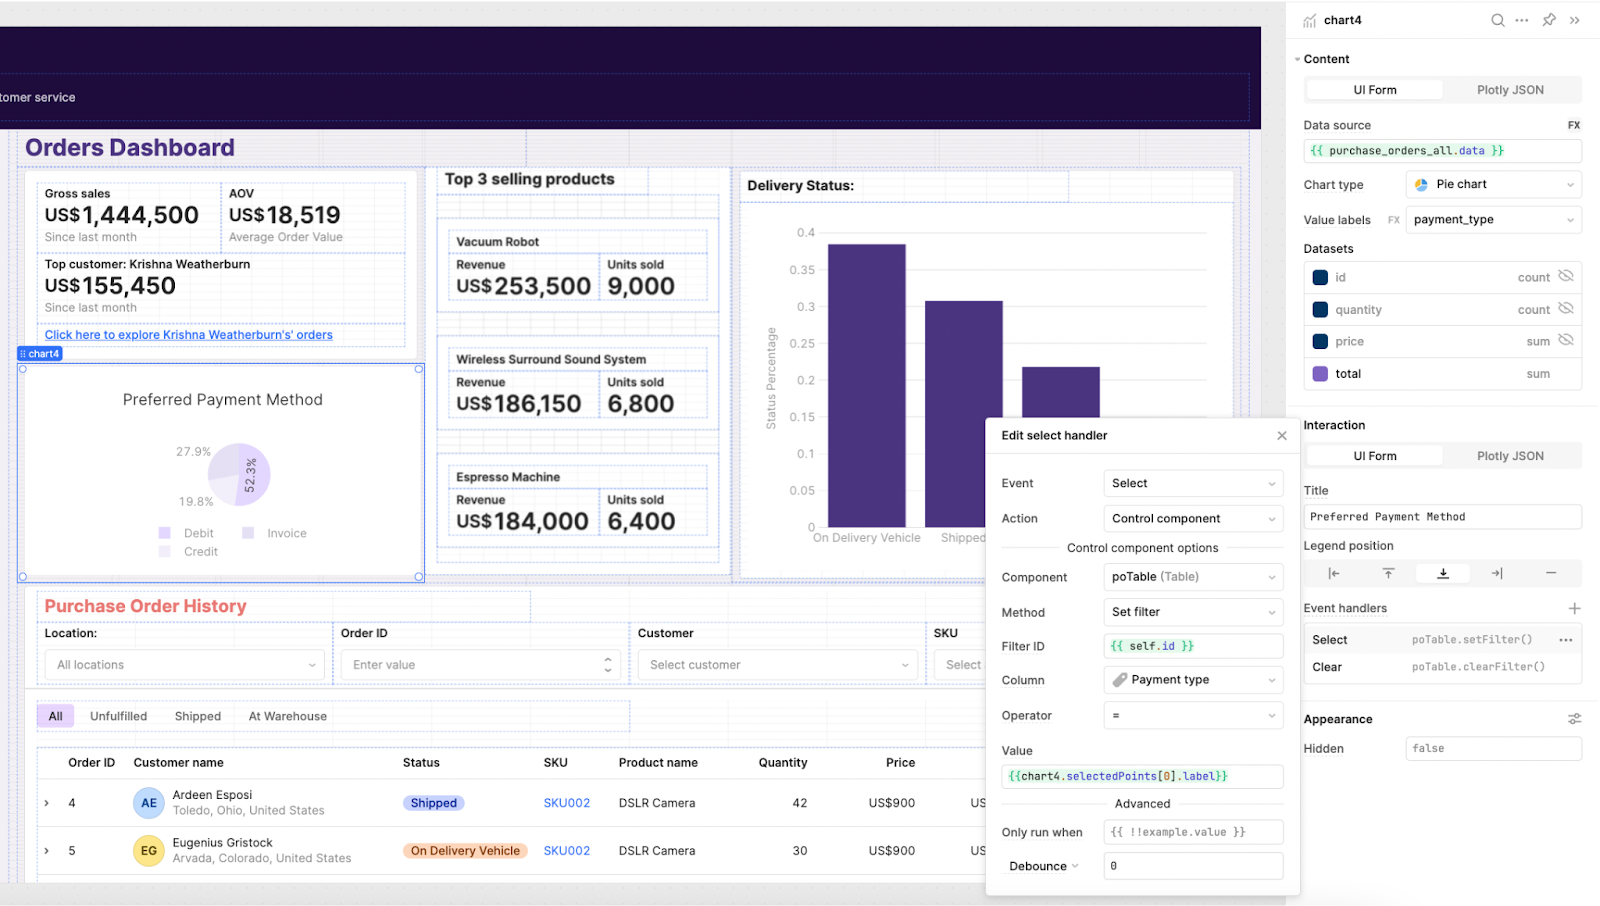
This is a handy UI feature that allows users to quickly analyze data in charts, without over-cluttering the UI with filter options.
Top products listview
To display the top products, we use a listview component for a couple of repeated rows. Again, we have set this up with an SQL query, which sums the purchase count and total amount grouped by each product. The results are ordered by the highest total, and limited to 3 values which are then presented in the Listview.
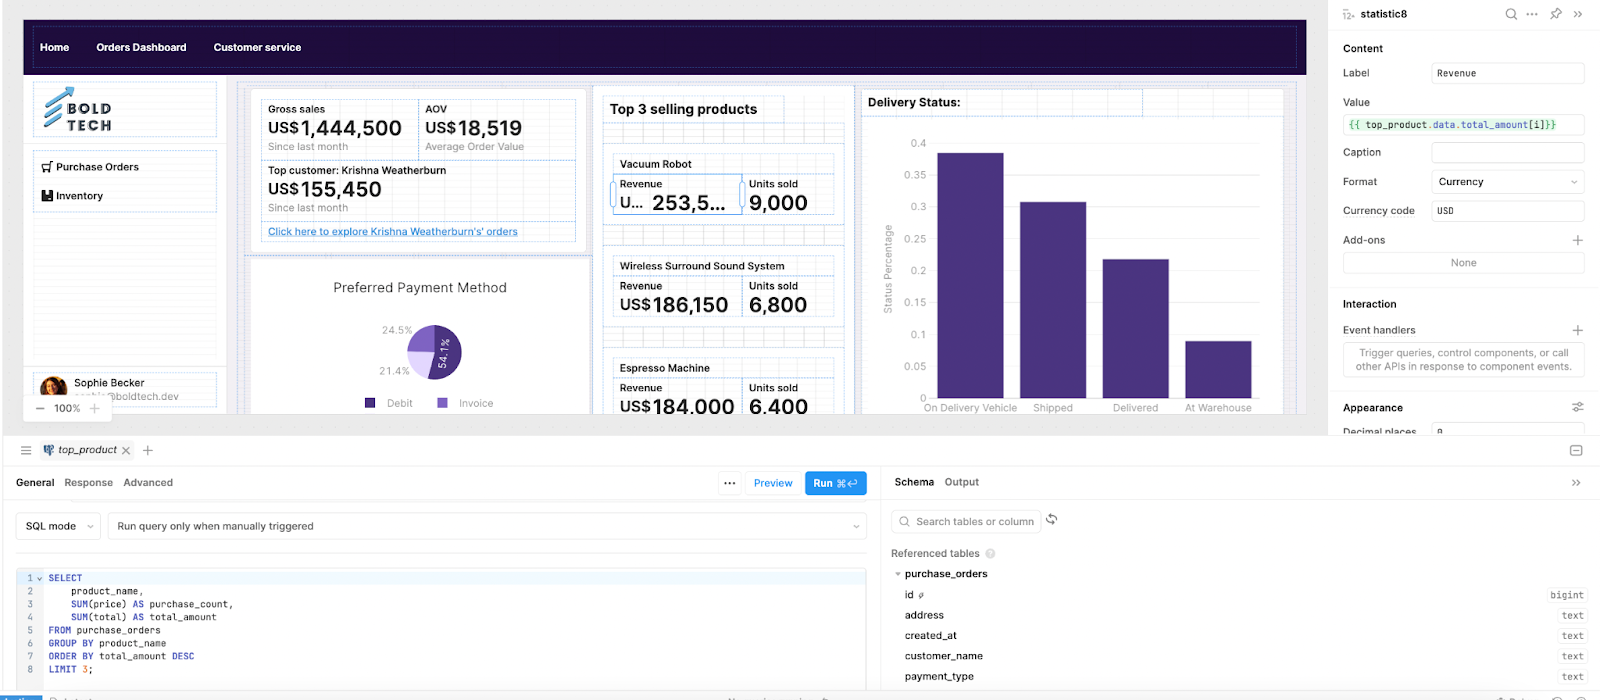
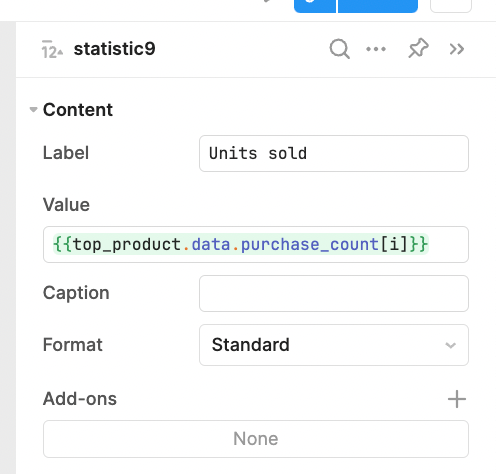
The first revenue statistic is then set to the ‘total_amount’ value we set in the SQL. We use [i] here since the Listview is repeatable, and it will simply return the indices in order. For the ‘Units sold’ metric, we use the ‘purchase_count’ value we calculated.
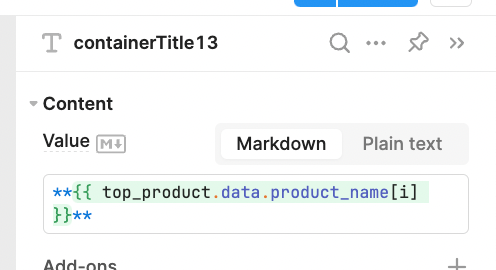
And for the product name, we reference them like so:
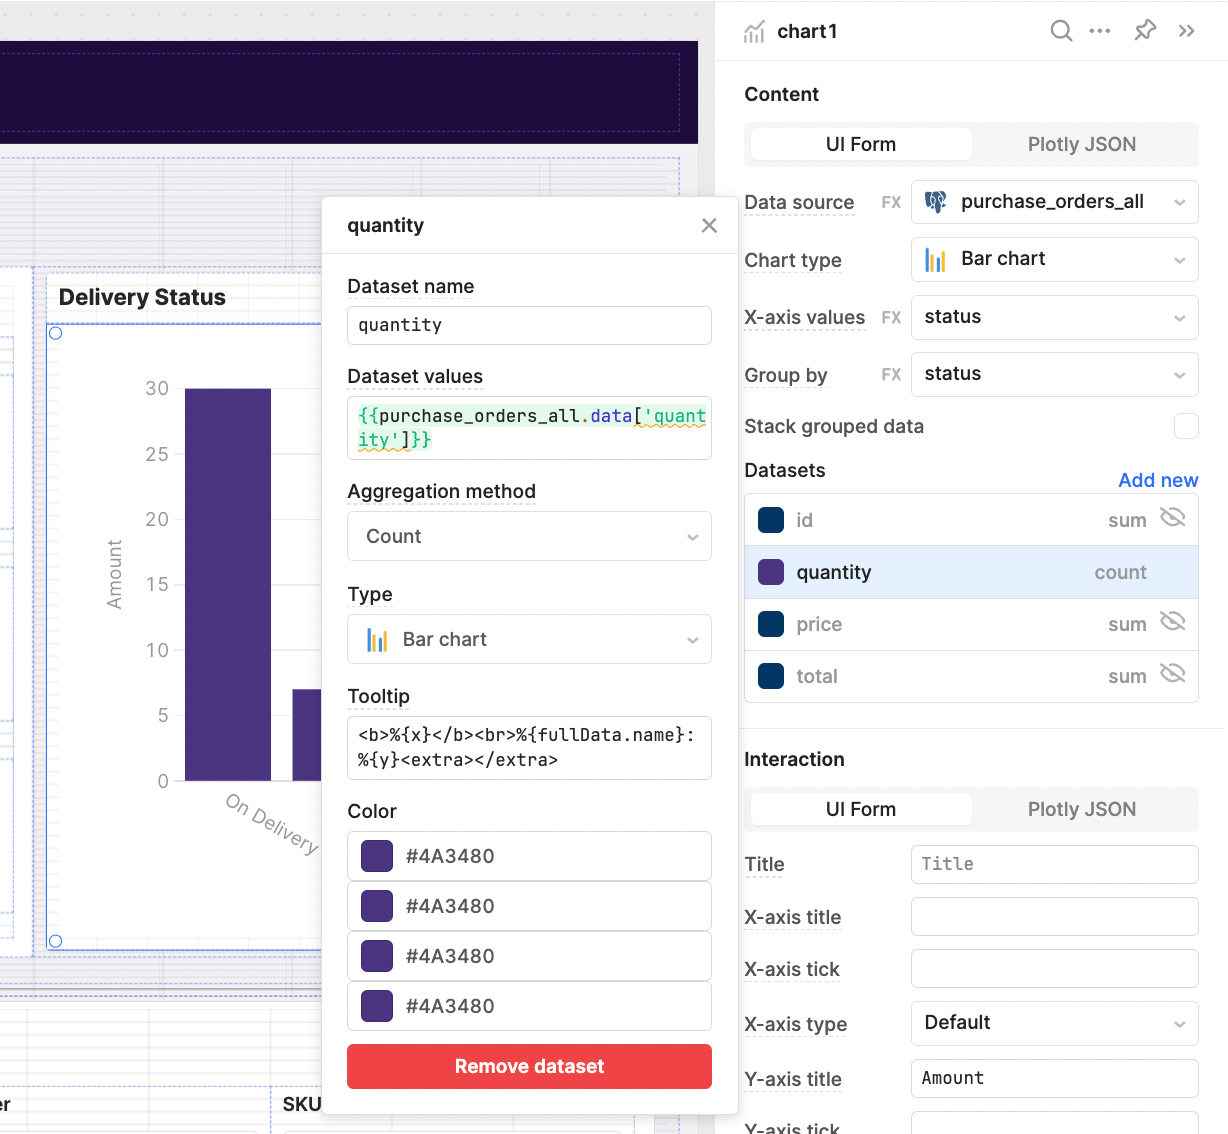
Delivery status bar chart
For our final stat, we have used a bar chart to display the total counts of the orders by delivery status. We used the UI of the chart component to count the number of orders for each status.
SKU modal pop-up to display product
We have two tables of data in our Supabase instance, one for purchase orders and one for inventory and product information. Since it’s so simple to pull data from both tables into our environment in Retool, we are going to integrate some of the inventory data into this purchase order ‘view’.
To do this we first need to set up another ‘GET’ query to pull in the inventory data. Just like with the purchase order data, we’ll simply select all data, using:
SELECT * from inventory
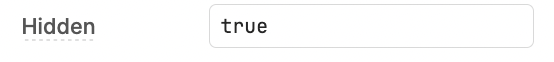
To display the information we’ll use a modal component. Pull this somewhere into your app and set the value of the ‘Hidden’ button to ‘true’, since we don’t need a button to open the modal and will use the SKU link instead.
Now, head back to the SKU column settings in the table component. Set the type to link. Add an event handler that will trigger the modal to open.
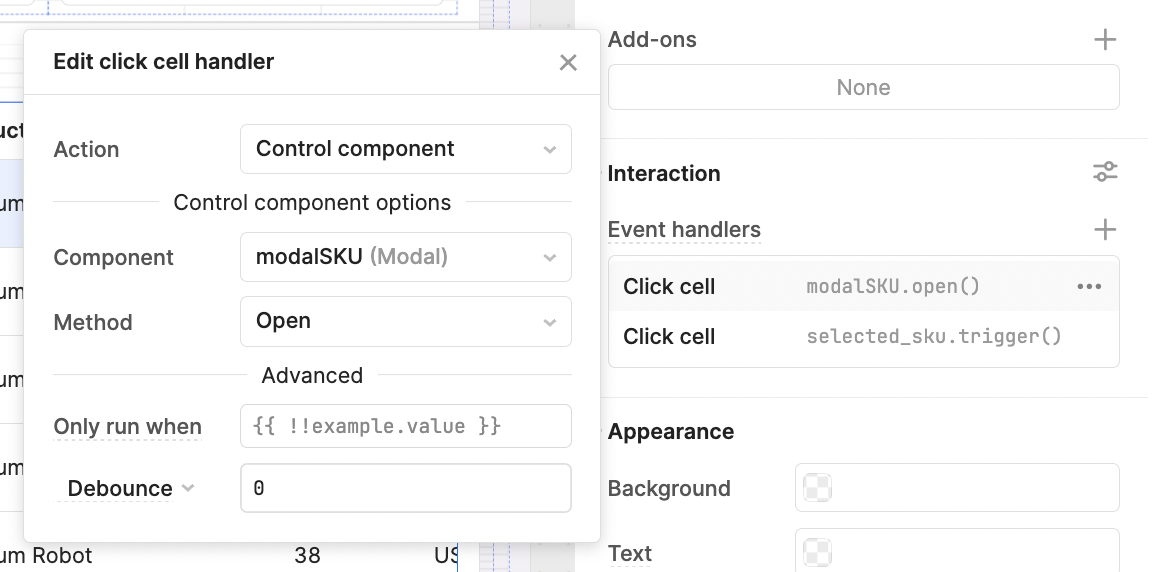
Now open the modal to add in the product information.
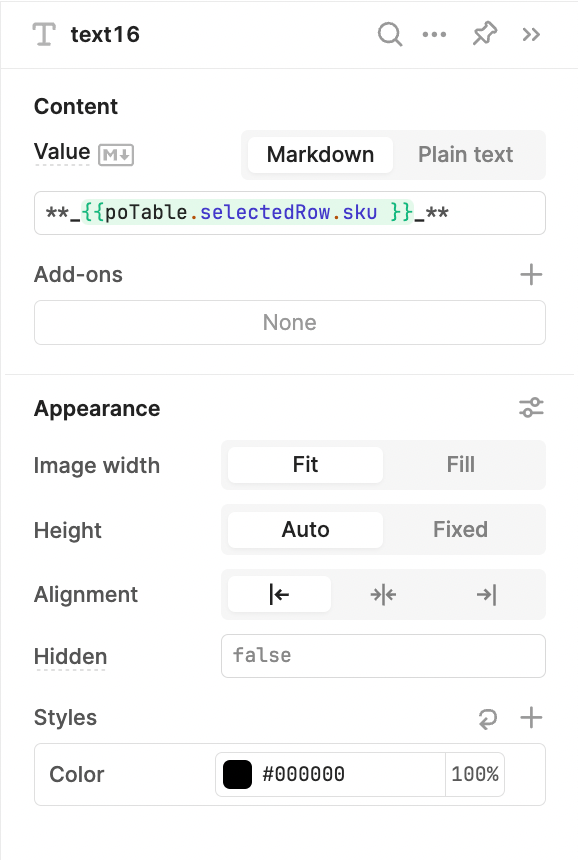
We’ve first pulled in a text component to display the SKU number. To do this we reference the SKU of the selected row in the table that was clicked. We did the same for the product name using:
#### {{poTable.selectedRow.product_name}}Note: the hashes are Markdown to set the size of the text as a header.
Next, we pull in another text component to display the remaining data. Using JavaScript in the text component, we will filter the data by the selected SKU to present data from the inventory table.
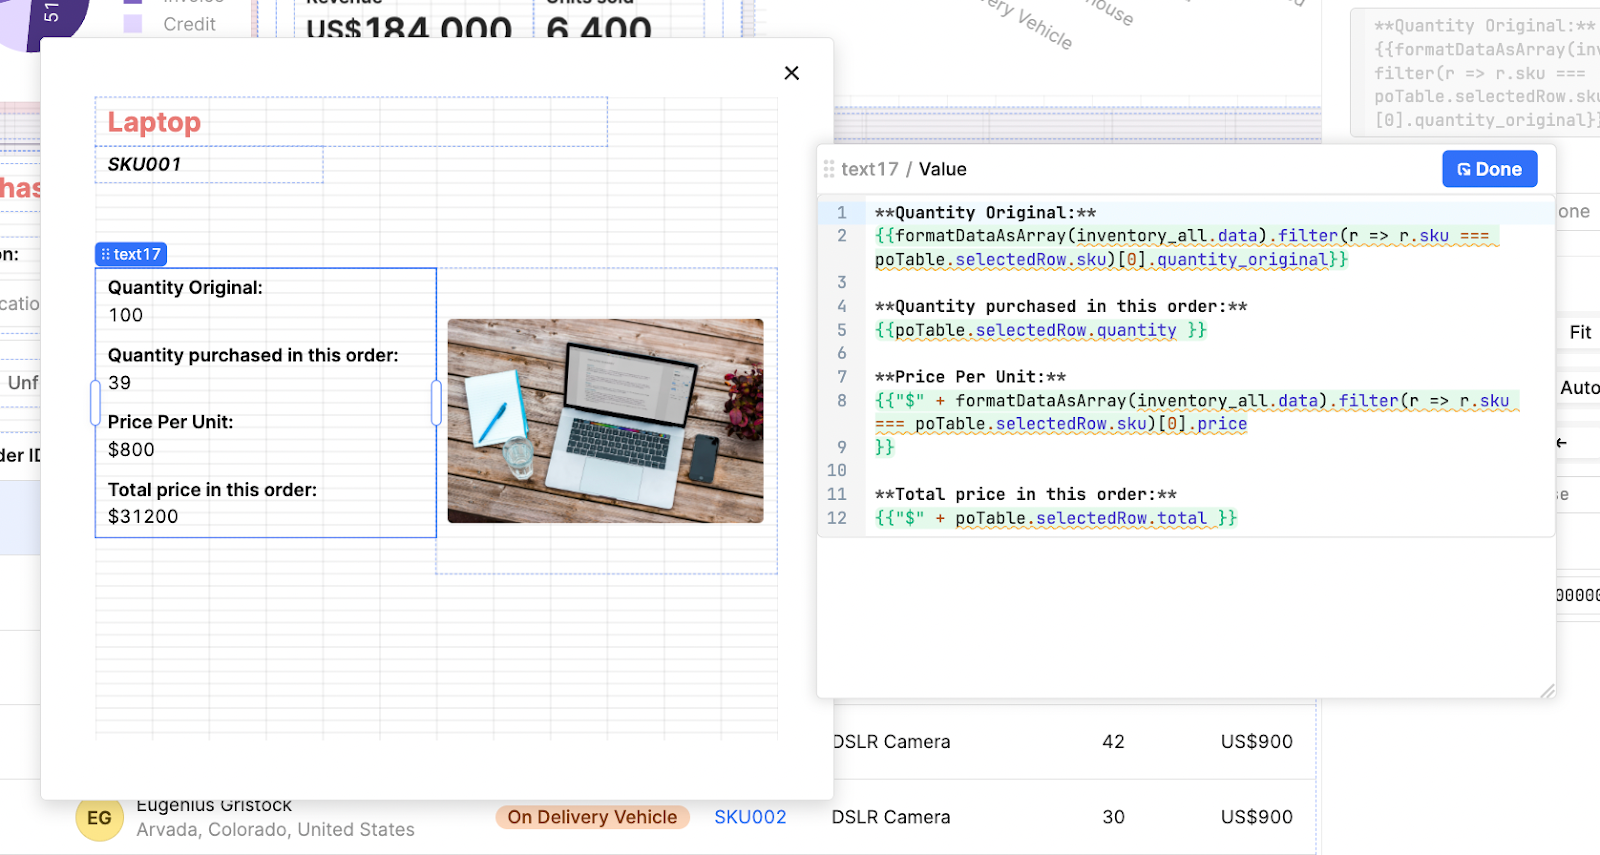
We also linked the image here using the URL in the database:
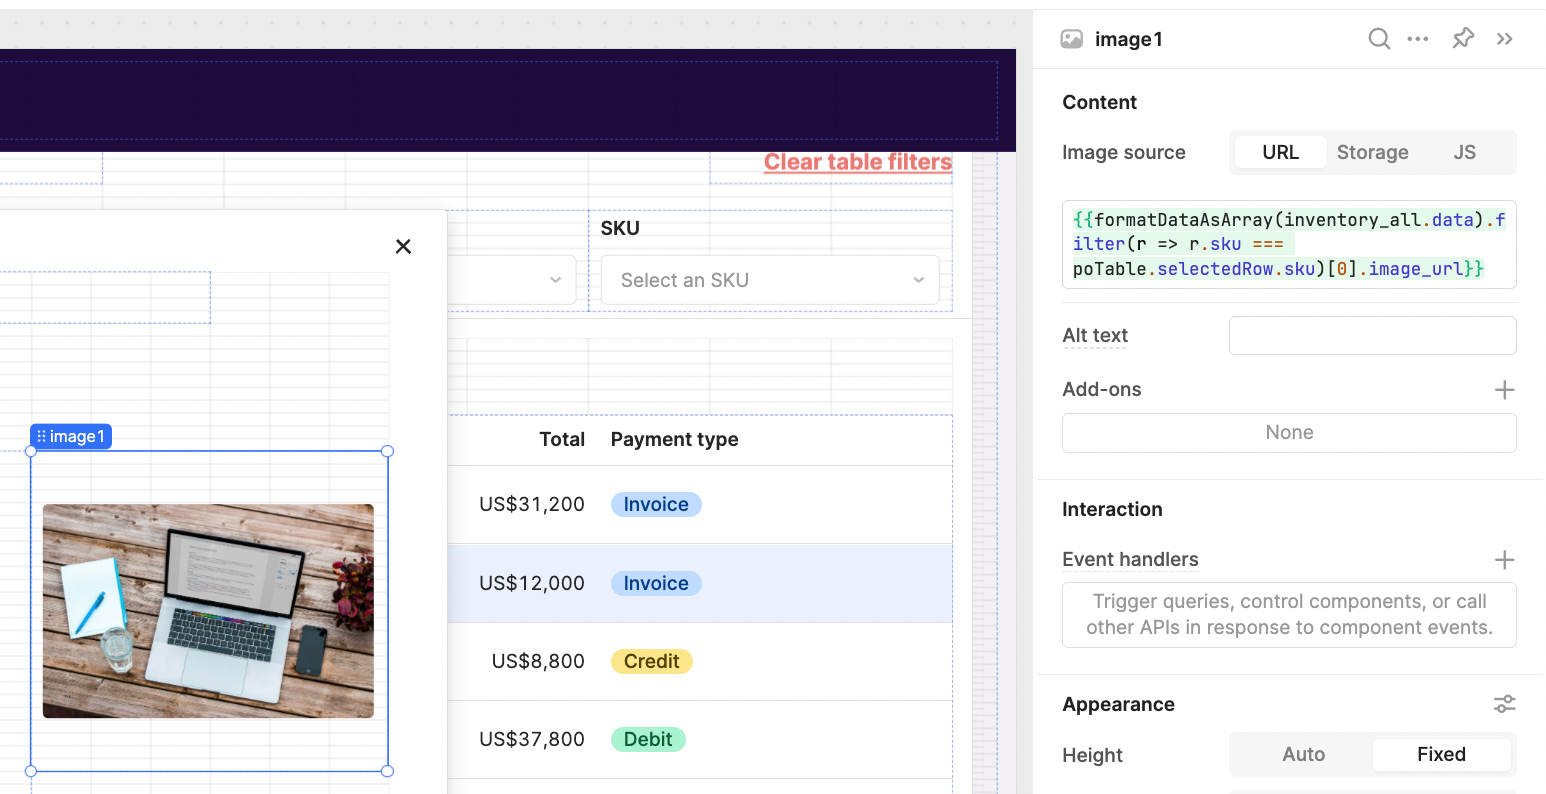
This could also be linked to the file storage available in Supabase, but a separate query would be necessary.
Now, with that, we have a fully functioning order management system with the ability to view and search orders quickly and easily, along with statistics to help visualize and understand this data.
Since we\'ve used Retool, this app is highly customizable and changes and new functions can be added within minutes. You can use this app we just built as a basis, and add functionality and additional resources to suit your use case.
In the next part of this 2-part tutorial, we\'ll be building a simple inventory tracking app that will allow us to Create, Read, Update, and Delete products in our catalog.
In part II we\'ve also released the template for this app to our newsletter members to import directly into your Retool environment:
 Sophie Becker
Want to learn more about internal tools and how to build them? Check out our sections on low-code tools like Notion and Airtable, or developer tools like Retool and Windmill.

