


L&D teams are often expected to demonstrate the impact of training programmes they can barely see. Attendance lives in spreadsheets, engagement is anecdotal, and the connection between what people are learning and how they're performing gets lost entirely. For teams running multiple programmes across locations, that lack of visibility makes it nearly impossible to spot problems early, allocate resources intelligently, or report with any confidence.
So Bold Tech built a Retool template which shows what a unified L&D management and tracking tool could look like - from platform-level performance down to individual class attendance patterns. To find out more about Retool, head to our 'What is Retool' guide on our blog, where we have a whole host of other Retool templates, tutorials and resources.
It's a blueprint for inspiration, not a finished product. Built on Retool, your team can adapt it to your specific programmes, metrics, and reporting needs, and get to production in a fraction of the time of traditional development.
Looking for the template download? Scroll to the bottom and download it. It’s free for all newsletter subscribers!
- Education
- Healthcare
- Media
- eCommerce
- Logistics ops
- HR/Recruitment
and more! Sign up for our newsletter to ensure you're always getting access to our free resources.
Platform Overview: the full picture at a glance
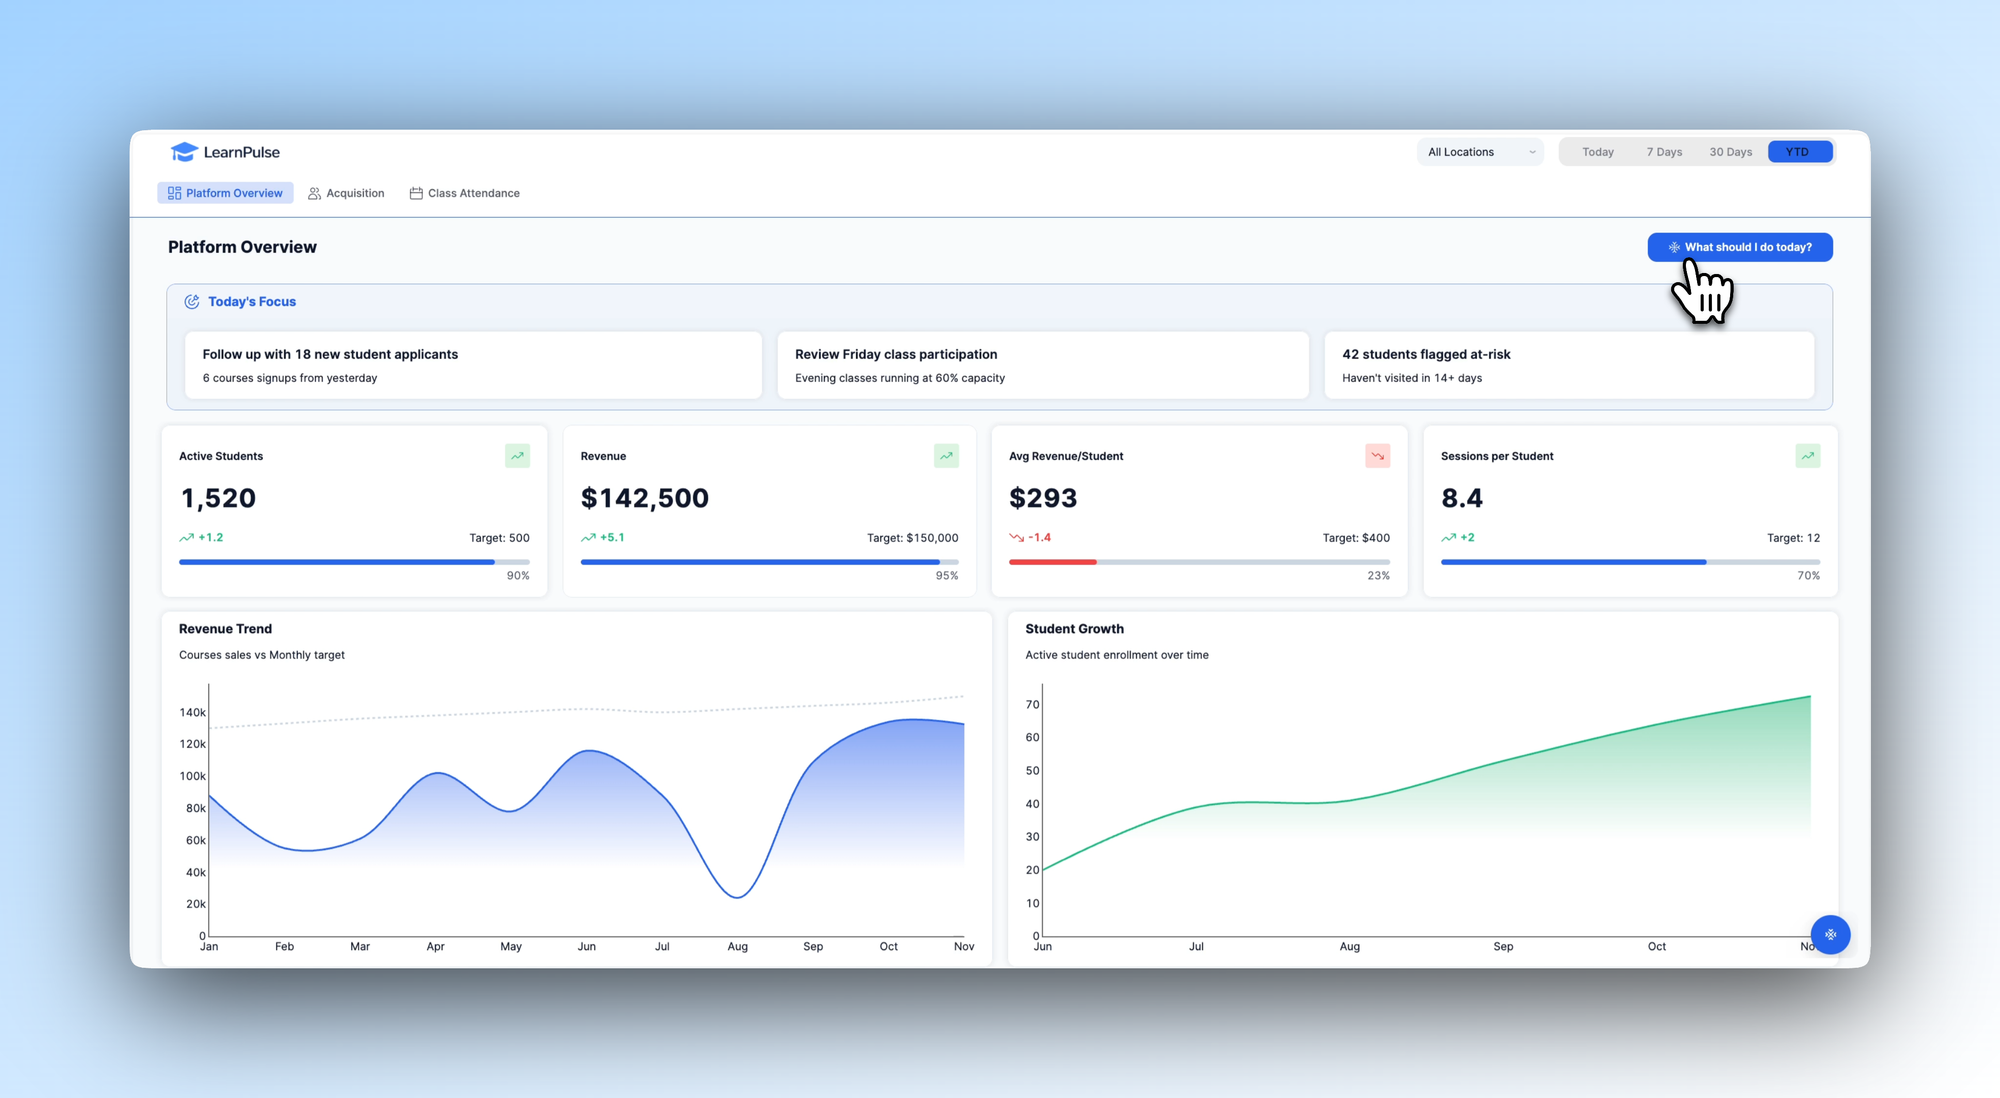
The Platform Overview tab illustrates how an L&D lead might design a single dashboard covering the metrics that matter most. A ‘Today's Focus’ panel at the top surfaces the most urgent actions - new applicants to follow up on, at-risk students who haven't engaged recently, classes running below capacity - so the day's priorities are clear before anything else.
Below that, KPI cards track active students, revenue, average revenue per student, and sessions per student, each showing progress against target and trend direction. Revenue trend and student growth charts round out the view, giving L&D and HR leadership the high-level narrative alongside the operational detail.
In your own build, you'd define the KPIs and focus prompts that reflect your programmes and goals - whether that's completion rates, learner satisfaction scores, or cohort-specific targets.
Acquisition: understanding how learners find and join your programmes
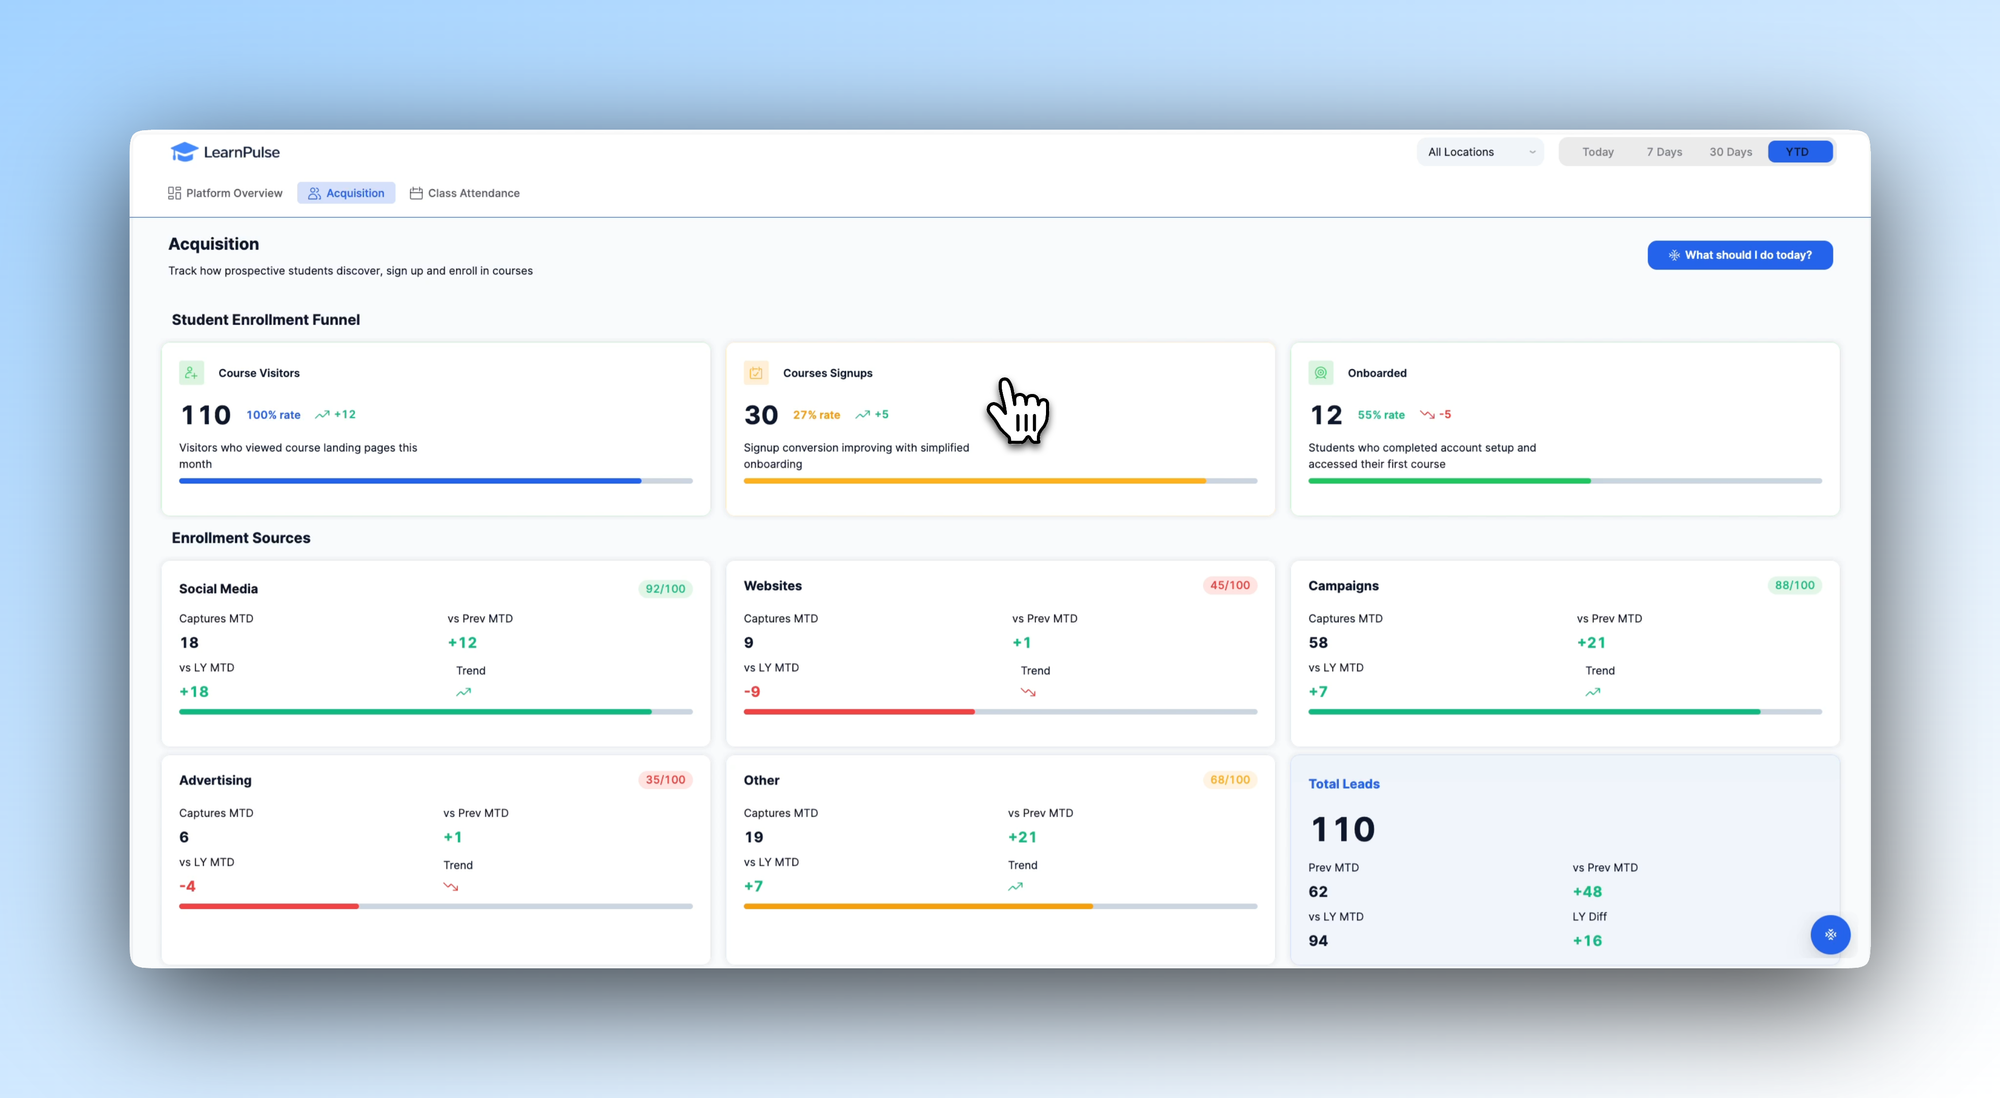
The Acquisition tab shows one way to design visibility into the full student enrollment funnel - from initial course visitors through to signups and onboarded learners. Each stage of the funnel is tracked with conversion rates and trend indicators, making it easy to see where prospective students are dropping off.
Below the funnel, an Enrollment Sources breakdown shows which channels - social media, website, campaigns, advertising - are driving the most leads and how each is trending month-on-month and year-on-year. For L&D teams managing paid or organic acquisition, this kind of view helps direct effort and budget toward what's actually working.
You'd adapt this tab to reflect the acquisition channels and enrollment steps relevant to your own programmes, whether that's internal sign-up flows, manager nominations, or external marketing.
Class Attendance: where engagement becomes visible
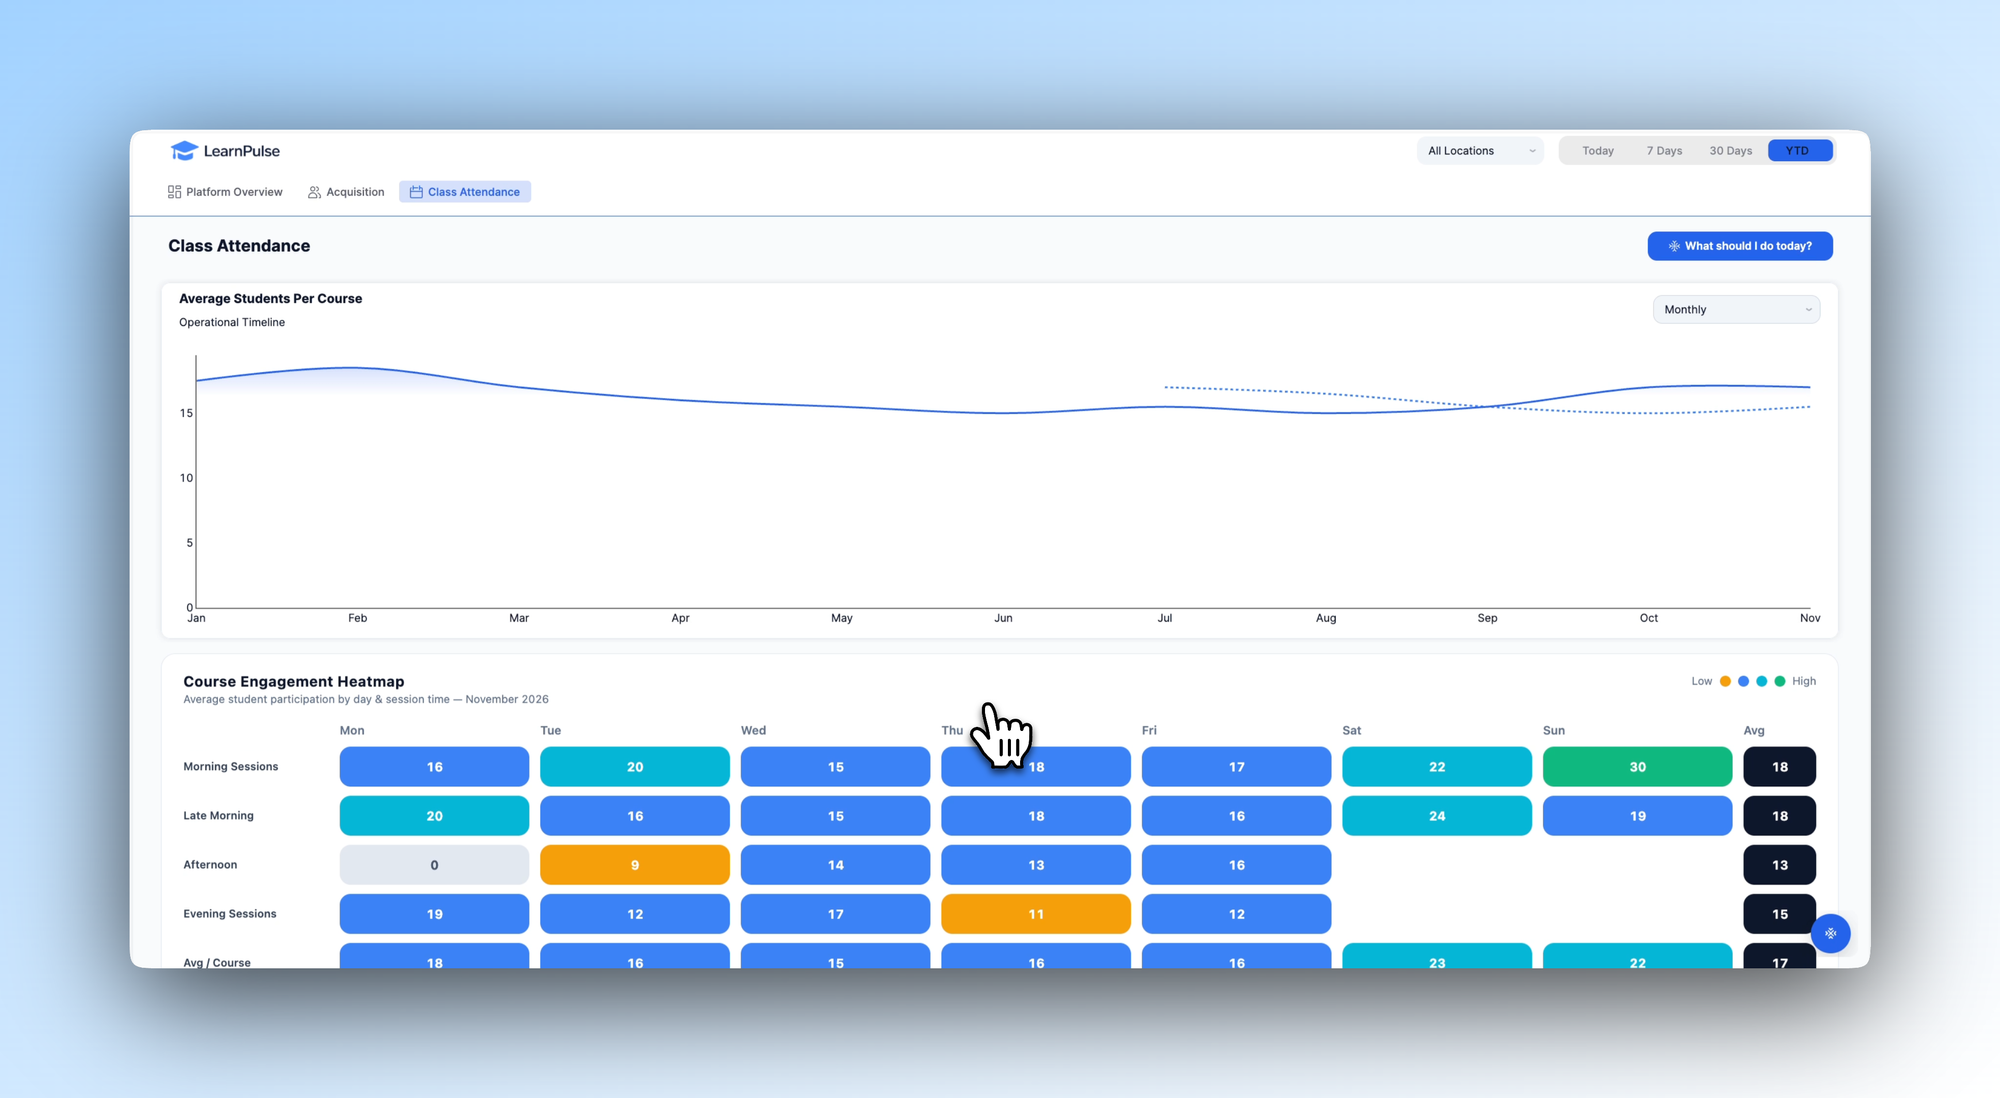
The Class Attendance tab illustrates how a team might design a view that surfaces participation patterns over time. An average students per course chart tracks attendance trends across the year, with a projected forecast line showing where things are heading.
Below it, a Course Engagement Heatmap breaks down average participation by day of the week and session time - immediately showing which slots are consistently well-attended and which are underperforming. For teams managing scheduling and resourcing decisions, that kind of granular visibility is hard to get from a spreadsheet and easy to act on when it's visual.
In your own build, you could extend this tab to track completion rates by cohort, flag individual learners who are falling behind, or connect attendance data to downstream performance metrics.
Download the template and get building ⬇️
L&D teams don’t lack the will to improve their programmes - they lack the data to know where to start. LearnPulse is a template for rethinking that: a practical, adaptable blueprint that shows what a centralized learning performance tool could look like, built on Retool and with scope for development around how your team actually tracks and improves training outcomes.
