


Learner success teams at EdTech platforms and online learning providers are responsible for something that's genuinely difficult to scale: making sure every learner gets the support they need, at the right moment. The learners who need the most support can be the least visible. They might be not raising their hand, not submitting support tickets, slowly disengaging until they drop out entirely. By the time it's obvious something is wrong, it's often too late to turn it around.
Visibility plus actionability is key. Most platforms generate plenty of data about learner behaviour - login frequency, assessment scores, milestone completions - but it rarely surfaces in a way that's actionable for the people responsible for learner outcomes. Success teams end up doing manual triage, chasing down cohort reports, and relying on gut feel about who to contact next.
Our Retool template shows what a proactive, data-driven learner success tool could look like; at-risk identification, intervention tracking, cohort health monitoring, and escalation management in one place, with Claude surfacing insights and recommended next steps throughout. It's a starting point to build from, not a finished product. Every part of it can be shaped around your platform's data, your cohort structure, and how your team actually supports learners.
At-Risk Learners: catch disengagement before it becomes dropout
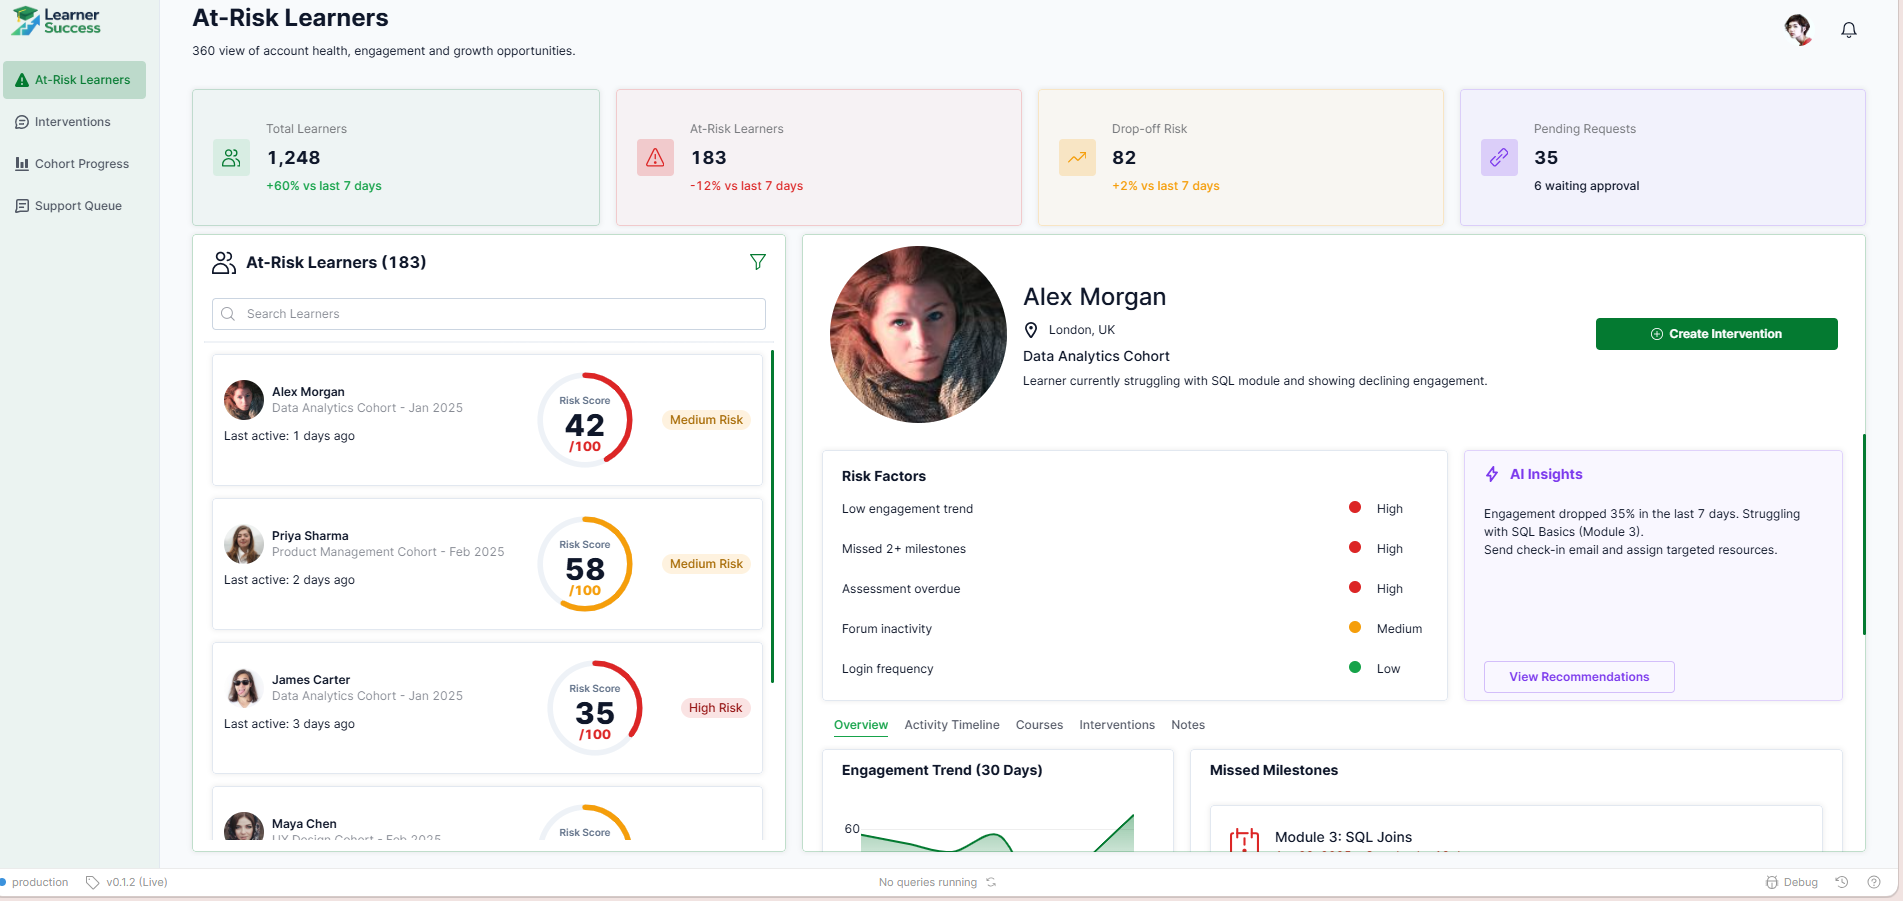
The At-Risk Learners tab illustrates how a learner success team might design a structured view of every learner showing early warning signs. Four KPI cards show total learners, at-risk count, drop-off risk, and pending requests - each with a trend indicator so the team can see whether the picture is improving or deteriorating week on week.
A filterable list of at-risk learners sits on the left, each with a risk score and last active date. Selecting a learner opens a full profile in the centre: risk factors broken down by severity - low engagement trend, missed milestones, overdue assessments, forum inactivity - alongside an AI Insights panel that summarises what's happening and recommends a specific next action, such as sending a check-in email or assigning targeted resources.
Depending on your platform's data model, this tab could be connected to your LMS or engagement tracking system and configured with your own risk scoring thresholds and intervention triggers.
Interventions: track every outreach, response, and outcome
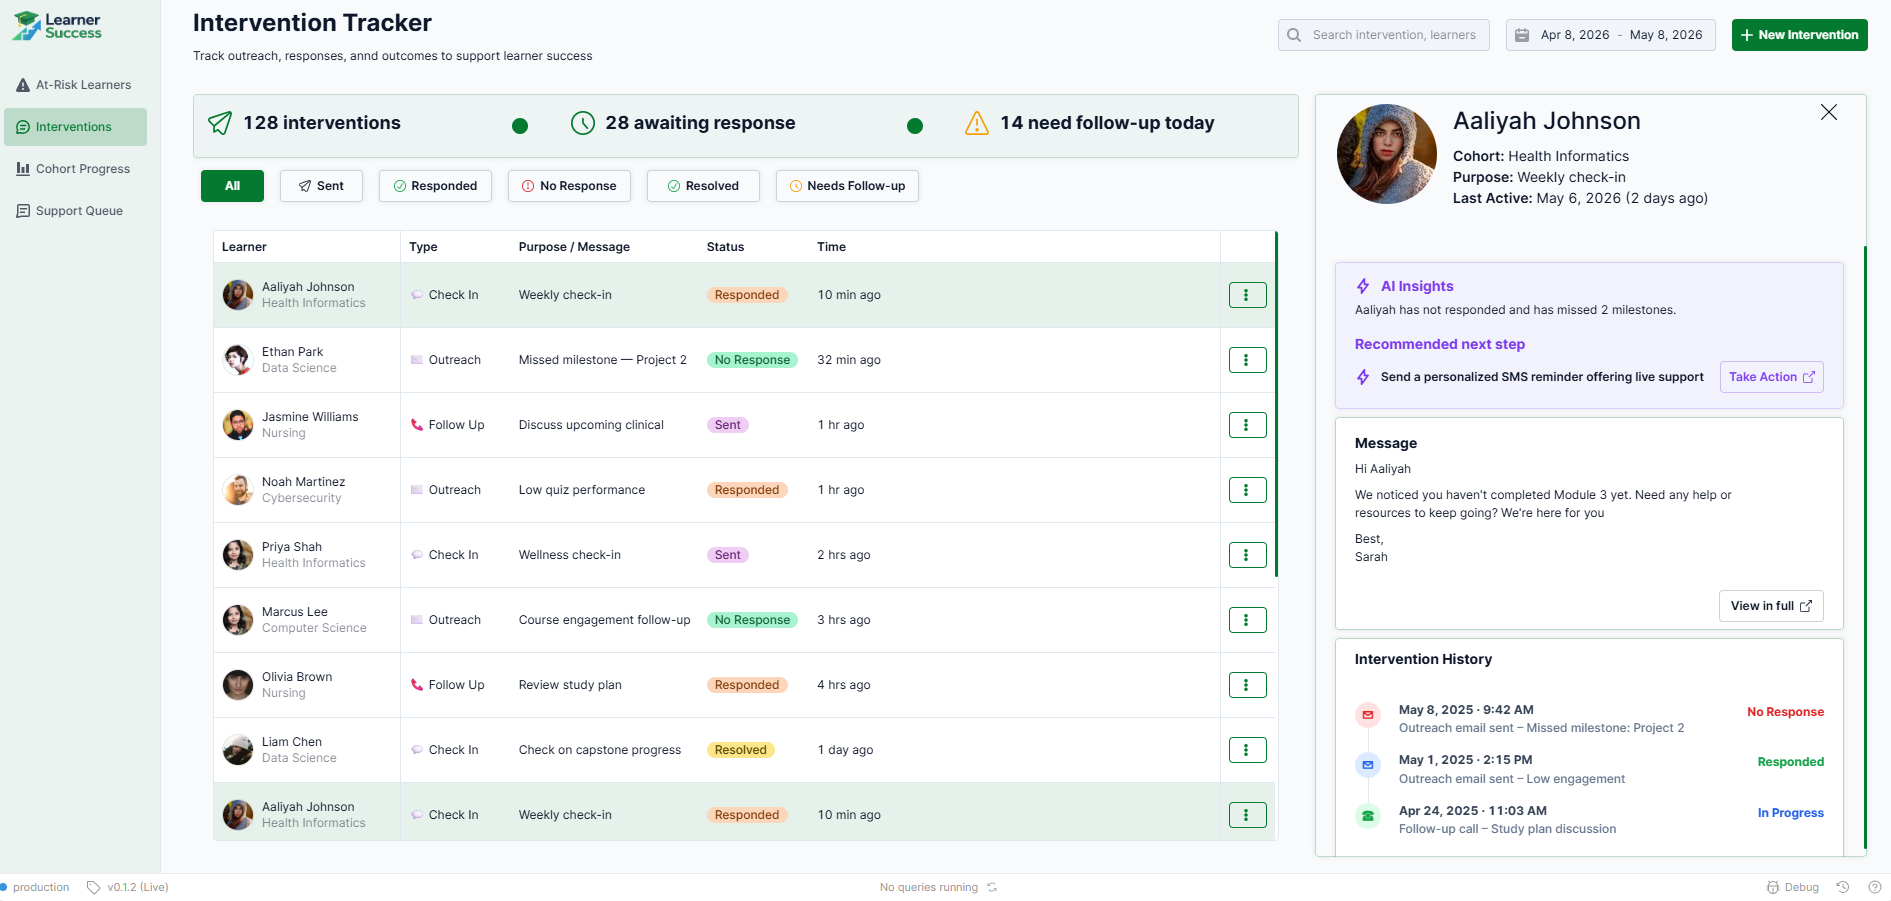
Knowing a learner is at risk is only half the job - the other half is making sure someone actually reaches out, and that the outreach gets tracked. This tab shows one way to design a structured intervention log that gives the team full visibility into what's been sent, what's been responded to, and what still needs follow-up.
A summary bar shows total interventions, those awaiting response, and those needing follow-up today. Each row in the queue shows the learner, intervention type, purpose, status, and time elapsed. Selecting a row opens a side panel with the learner's cohort context, an AI insight on their current situation, a recommended next step, and the full intervention history - so whoever picks it up has everything they need without having to dig.
Based on how your team manages outreach, this could be extended to include templated messages, automated follow-up triggers, or integration with your email or SMS tools.
- Education
- Healthcare
- Media
- eCommerce
- Logistics ops
- HR/Recruitment
and more! Sign up for our newsletter to ensure you're always getting access to our free resources.
Cohort Progress: a health check across every programme
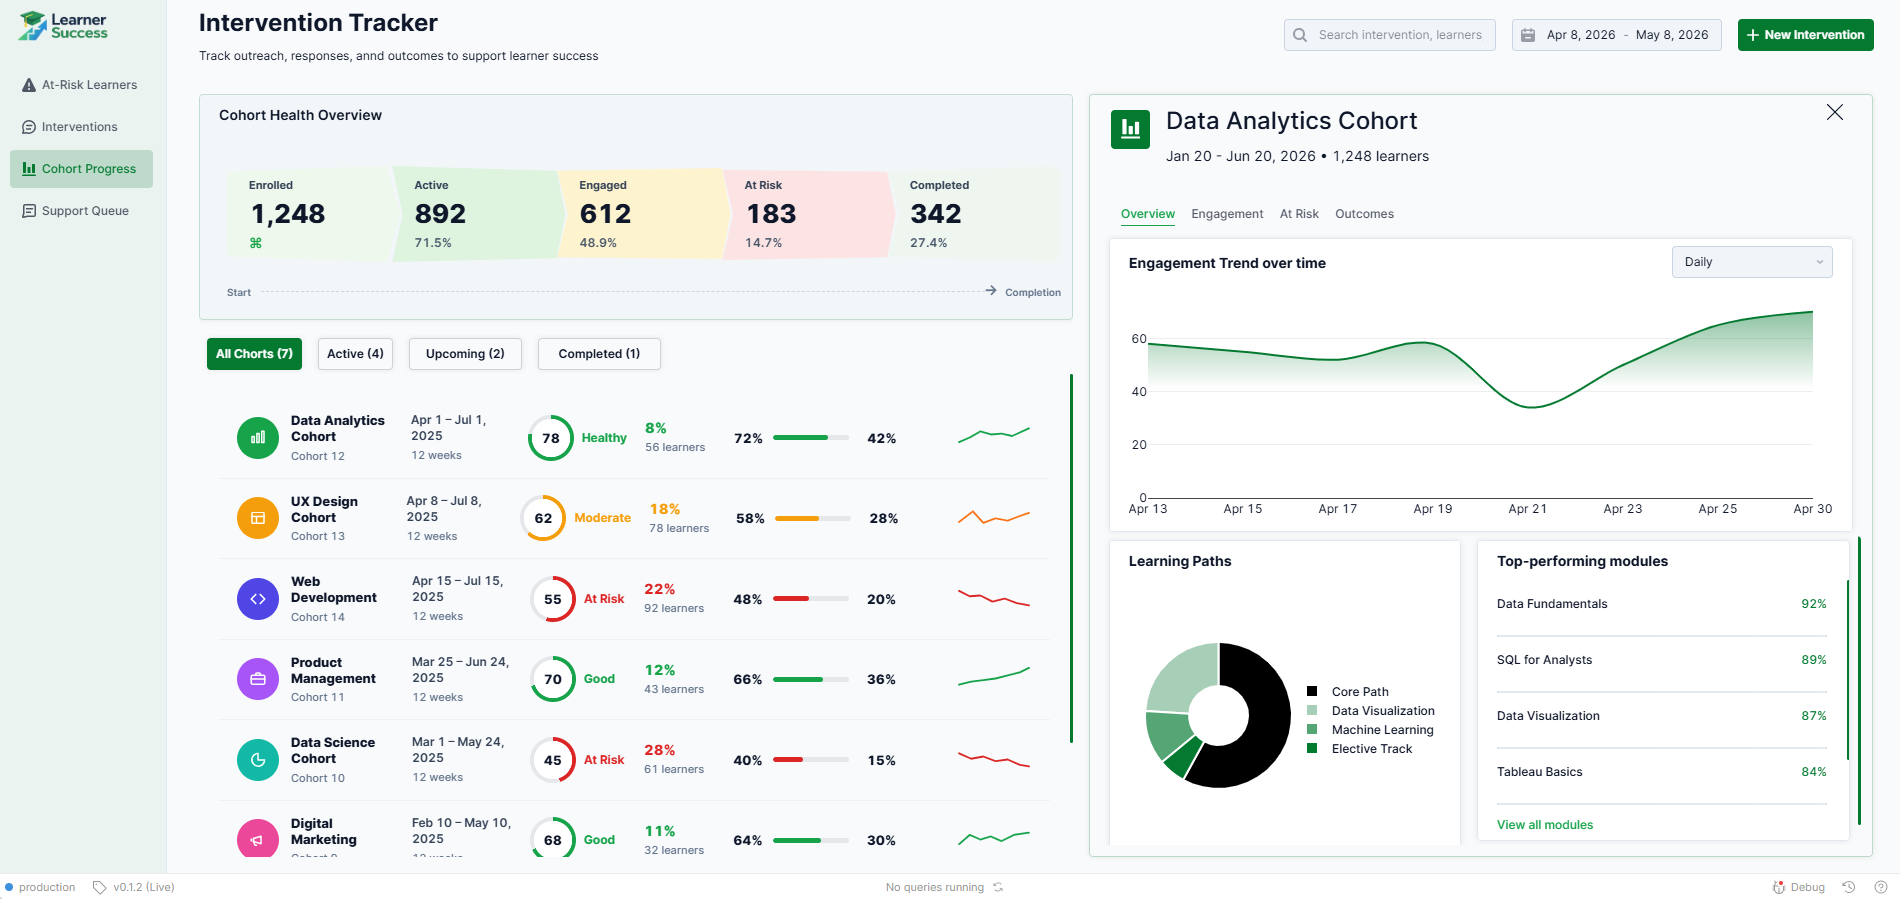
Individual learner risk matters, but so does cohort-level health - and the two don't always tell the same story. Understanding whole-cohort health can be instrumental in identifying issues with programme and curriculum design, as well as other structural issues, and subsequently empowering you to do something about it. This tab illustrates how a team might design an overview of all active, upcoming, and completed cohorts in one place.
A Cohort Health Overview at the top shows enrolled, active, engaged, at-risk, and completed counts across the full learner base. Below that, each cohort is listed with its health score, at-risk percentage, completion rate, and a trend line - making it easy to spot which programmes are performing well and which need closer attention. Selecting a cohort opens a detailed panel with engagement trend over time, learning path breakdown, and top-performing modules.
This is particularly valuable for EdTech teams running multiple concurrent cohorts - it surfaces the signal that matters without requiring a separate BI tool or manual report pull. We'd recommend connecting this to your course completion and engagement data as a first priority when building this out.
Support Queue: escalated cases handled with full learner context
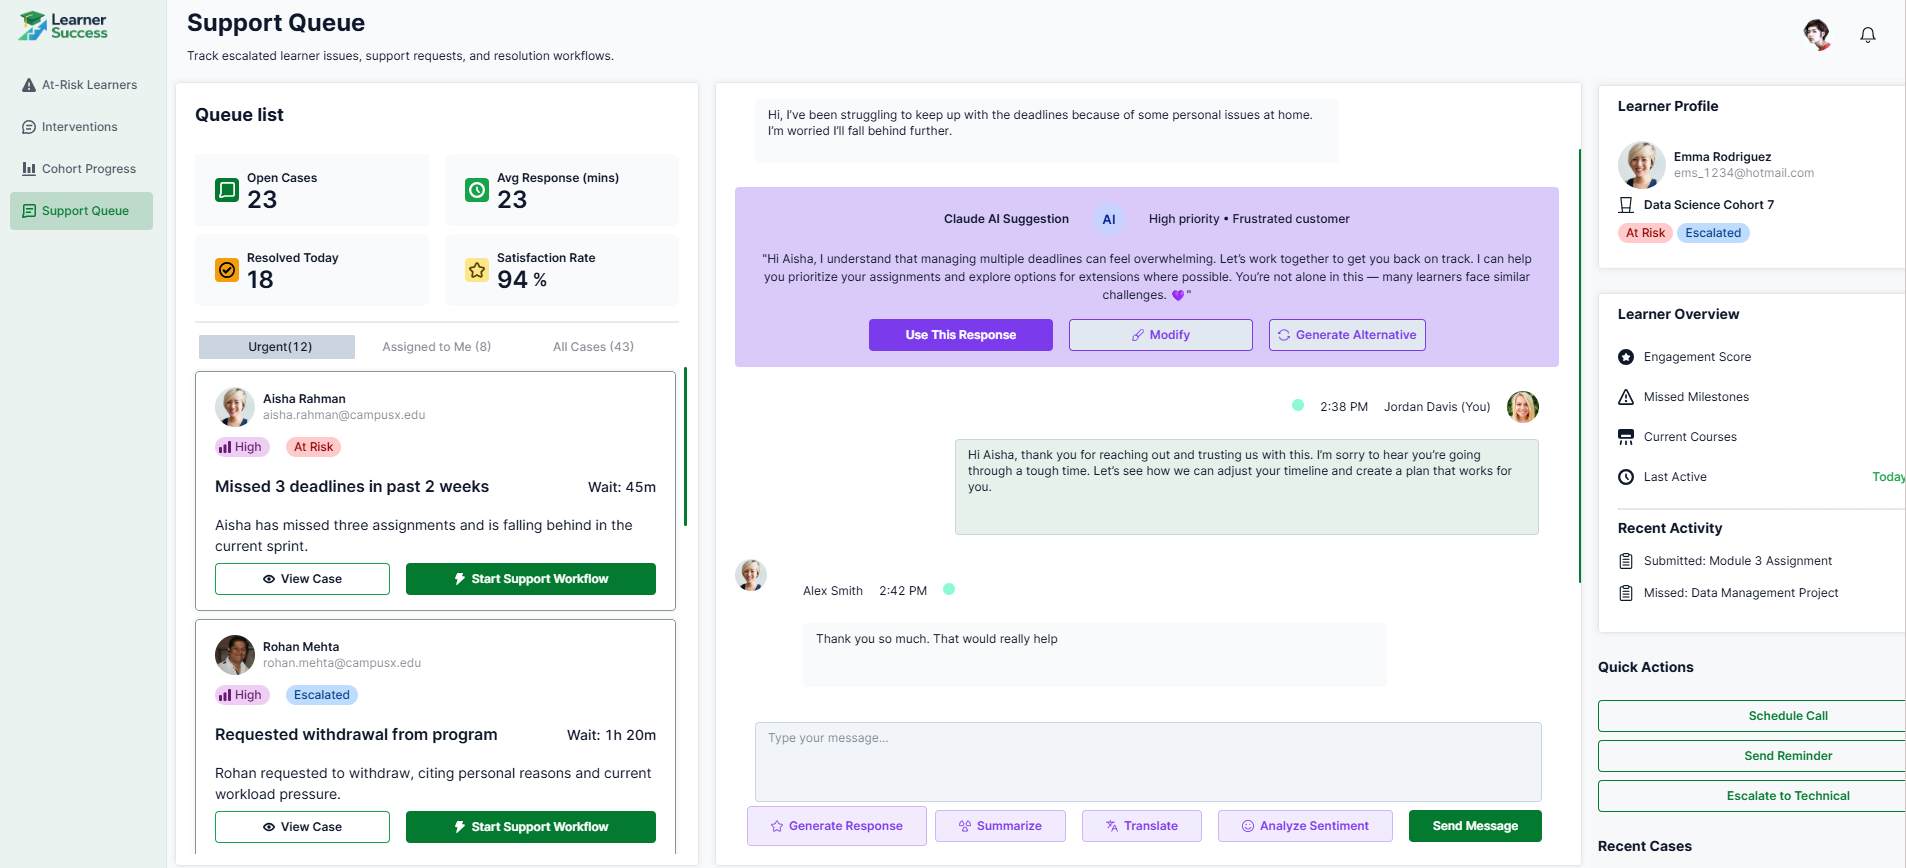
Some learner situations go beyond a check-in email - a missed deadline due to personal circumstances, a withdrawal request, a learner who's clearly struggling and needs a real conversation. This tab shows how those escalated cases can be managed in a structured support queue, with the full learner context available to whoever is handling them.
The queue is filtered by urgency - urgent, assigned to me, all cases - with each case showing priority, risk status, issue summary, and wait time. Opening a case surfaces the conversation thread in the centre panel, with a Claude AI suggestion pre-drafted based on the learner's situation and tone. A learner profile on the right shows engagement score, missed milestones, current courses, and recent activity, so the agent isn't starting cold. Quick actions - schedule a call, send a reminder, escalate - sit alongside the full case history.
The structure here mirrors a CS support tool deliberately - learner success at scale has more in common with customer support than most EdTech teams realise, and the tooling should reflect that.
Download the template and get building ⬇️
Learner success teams don't need more data - they need a tool that tells them who to contact, why, and what to say. This template is a starting point for building that: a practical blueprint that shows what a proactive, AI-assisted learner success tool could look like, before a single line of custom code is written.
